This article was co-produced with Dividend Sensei.
Since the beginning of the year I have been writing one weekly non-REIT article on Seeking Alpha. This has enabled me to become a better investor (by diversifying my retirement portfolio) and also to assist readers with selecting non-REIT dividend paying stocks.
Also, this weekly series has helped my mother who is always looking to purchase shares in high-quality stocks. Keep in mind, there are seven proven methods of achieving stock market-beating returns, thereby compounding wealth over time.
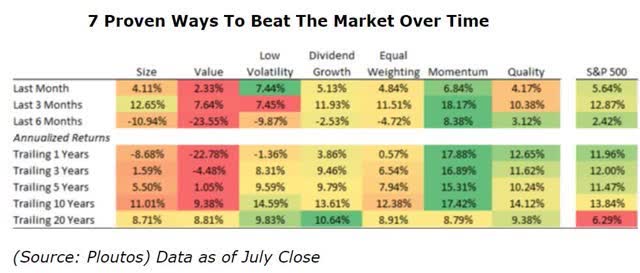 Since no strategy will work all the time, it's prudent to buy companies that combine several alpha factors. This includes
- Dividend growth
- Quality (high returns on capital)
- A good to great value.
This brings me to Intel (INTC), which has fallen almost 19% since announcing earnings on July 23.
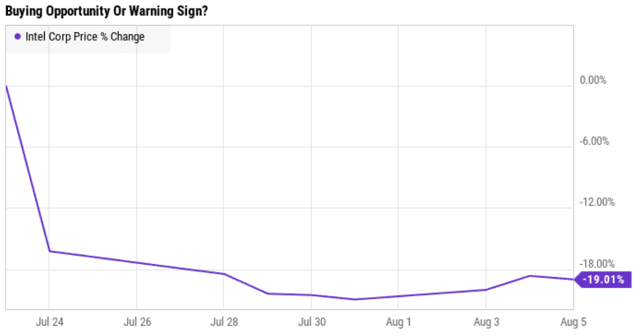 (Source: Ycharts)
Intel is certainly a high-quality company – a 10/11 SWAN, in fact. While its six-year dividend growth streak isn't particularly impressive… the fact that it's been paying it uninterrupted since late 1992 certainly is.
Intel Total Returns Since 1986
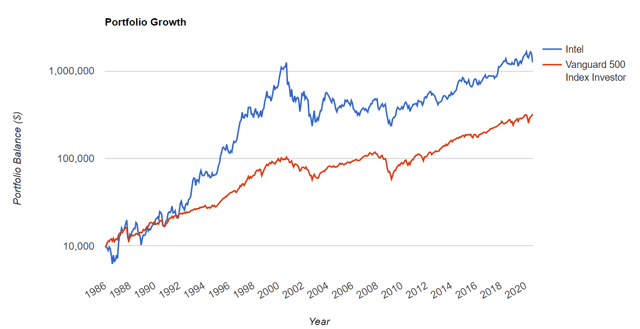
(Source: Portfolio Visualizer)
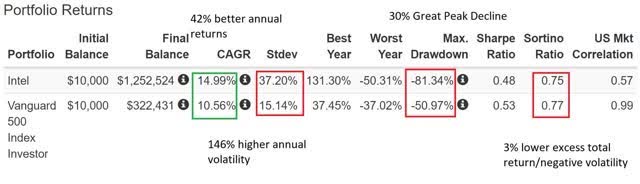
Plus, Intel has made a fortune for investors over the past 34 years, turning $10,000 into over $1.25 million.
Though, admittedly, that 42% annual return came at the cost of incredible volatility.

 (Source: Portfolio Visualizer)
It also needs to be said that most of that run was a result of the tech bubble, which led to extreme overvaluations. Foolish investors who bought at the top lost at an almost 6% compound annual growth rate (CAGR) over the next decade.
Over the last nine years, meanwhile, the tech giant has offered 7% CAGR. And the same is forecasted through 2022. Plus, its volatility has dropped as well.
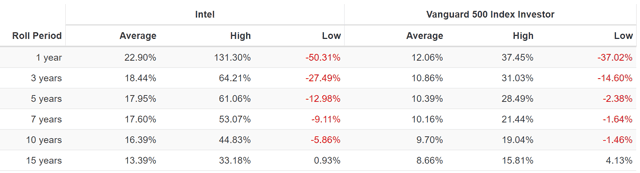
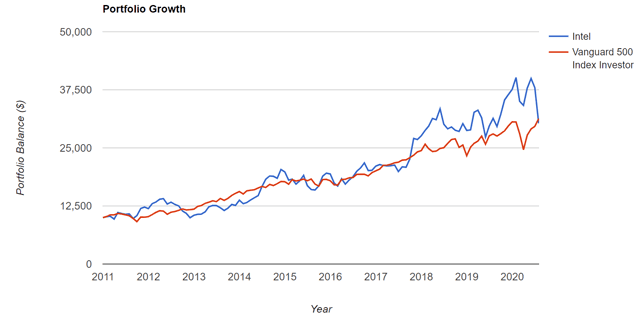
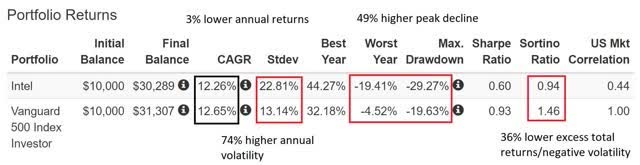
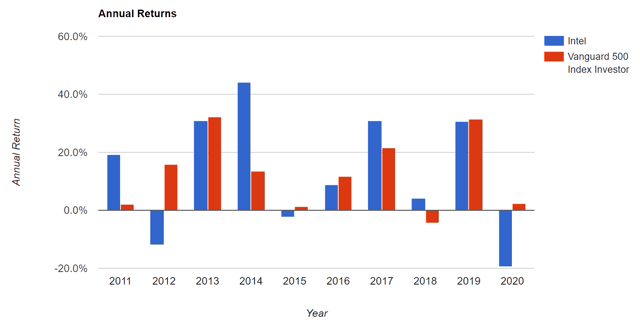
Intel Total Returns Since 2011
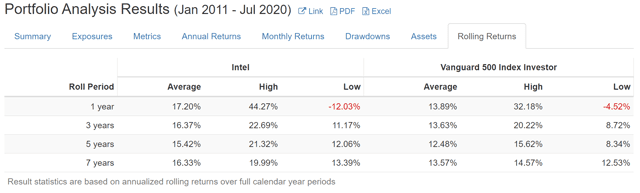 (Source: Portfolio Visualizer)
And here are some other points to consider:
- It has delivered over 12% CAGR total returns over this time, tripling investor's money.
- Its annual volatility of 23% is actually below the 26% average of most other companies
- Its average rolling returns have been over 15% CAGR over the last nine years
We believe in buying quality wide-moat blue-chips when they’re reasonably or attractively priced, such as after major selloffs… like the one Intel is in.
1. Why Intel Plunged After Earnings
Intel's earnings weren’t actually bad. The company beat top- and bottom-line estimates by about 5% and 10% respectively – raising 2020 revenue guidance by $1.5 billion as well.
The reason for the selloff was news that its 7-nanometer chip is being delayed until 2022 or 2023 – which opens the door to rivals like Advanced Micro Devices (AMD) to win market share over the medium-term.
Three years is an eternity on Wall Street, where 12-month price targets are analysts’ primary way to make upgrades/downgrades.
So it's not surprising that their reaction was swift. No less than seven downgraded the company the very next day.
Further adding to the uncertainty was the July 27 announcement that Intel is making major engineering changes:
- Chief Engineering Officer Murthy Renduchintala will depart, effective August 3.
- The Technology, Systems Architecture, and Client Group will be split into five teams, with each team's leader reporting directly to CEO Bob Swan.
Intel says these are meant to "improve focus and accountability in process technology execution." But as Motley Fool's Billy Duberstein recently explained (emphasis added):
Intel had already fallen behind competitors in its transition to 10-nanometer chips, going from a leader in the industry to a laggard behind [AMD]… which uses Taiwan Semiconductor Manufacturing (TSM) for its manufacturing process.
Now with a further delay in its next node transition, investors are fearing Intel's current industry-leading market share and profitability could take a hit in the years ahead...
Naturally, management can be expected to try to post a positive spin on any significant business setbacks. On the other hand, no one knows the company better than its chief executives. and Intel does have significant competitive advantages that give it the resources to overcome its recent challenges.
As it has for decades.
 So let's take a close and in-depth look at Intel's fundamental thesis. That way, we can see just how the facts – as best as we can know them right now – play out for this legendary giant and beloved dividend growth stock.
2. Intel Remains a Very Dependable Dividend Growth Stock
The first thing we should focus on is dividend safety.
After all, income investors are counting on Intel’s relatively generous (for a tech company) dividend to remain safe and growing while they wait for management to execute on its long-term growth plans.
Below, we show The Dividend Kings Safety Score. It’s a five-point scale designed to estimate the probability of a dividend cut in both normal recessions and this current recession – which economists expect to be four to six times as severe as most.
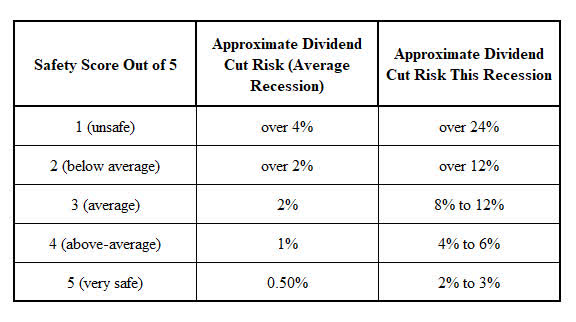
How do we estimate the risk of a dividend cut in recessions? By calibrating the safety model to the S&P 500, which is a proxy for average quality companies.
We then use historical S&P dividend-cut data to calibrate the probabilities of companies with average, above-average, and very safe dividends.
 (Sources: Moon Capital Management, NBER, Multipl.com)
In terms of the scores themselves, those are based on 18 safety metrics:
- Payout ratio vs. safe level for the industry (historical payout ratio vs. dividend-cut analysis by industry/sector)
- Debt/EBITDA vs. safe level for industry (credit-rating agency standards)
- Interest coverage ratio vs. safe level for industry (credit-rating agency standards)
- Debt/capital vs. safe level for industry (credit rating agency standards)
- Current ratio (total current assets/total current liabilities)
- Quick ratio (liquid assets/current liabilities (to be paid within 12 months)
- S&P credit rating and outlook
- Fitch credit rating and outlook
- Moody’s credit rating and outlook
- 30-year bankruptcy risk
- Implied credit rating (if not rated, based on average borrowing costs, debt metrics and advanced accounting metrics)
- Average interest cost (cost of capital and verifies the credit rating)
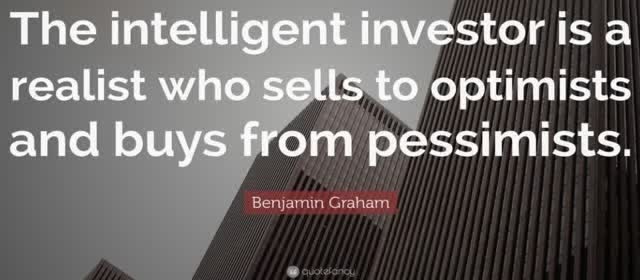
- Dividend growth streak (vs. Benjamin Graham’s 20 years of uninterrupted dividends standard of quality)
- Piotroski F-score (advanced accounting metric measuring short-term bankruptcy risk)
- Altman Z-score (advanced accounting metric measuring long-term bankruptcy risk)
- Beneish M-score (advanced accounting metric measuring accounting fraud risk)
- Dividend-cut risk in this recession (based on blue-chip economist consensus)
- Dividend-cut risk in a normal recession (based on historical S&P dividend cuts during non-crisis downturns)
While Intel is far from a perfect company and management has a lot to improve in the future… dividend safety isn't one of them. Here's why it scores 5/5 on dividend safety:
- 2020 consensus free cash flow (FCF) payout ratio: 32% vs. 50% safe for this industry
- Debt/capital: 29% vs. 40% safe
- Debt/EBITDA: 1.0 vs. 1.5 or less safe
- Interest coverage ratio: 30.7 vs. 8+ safe
- Current ratio: 1.97 vs. 1+ safe
- Quick ratio: 1.58 vs. 1+ safe
- S&P credit rating: A+ stable outlook, 0.6% 30-year bankruptcy risk
- Fitch credit rating: A+ stable outlook, 0.6% 30-year bankruptcy risk
- Moody’s credit rating: A1 (A+ equivalent) stable outlook, 0.6% 30-year bankruptcy risk
- Dividend growth streak: 6-years, 27 years uninterrupted dividends vs. 20-year Graham standard of quality
- F-score: 7/9 vs. 4+ safe, 7+ very safe: very low short-term bankruptcy risk
- Z-score: 3.59 vs. 3+ very safe = very low long-term bankruptcy risk
- M-score: -2.84 vs. -2.22 or less safe = very low accounting fraud risk
- Safety score: 5/5 very safe
- Dividend-cut risk in this recession: 2%-3%
- Dividend cut risk in a normal recessional: 0.5%.

(Source: Gurofocus)
Intel's balance sheet has been negatively impacted by the recession as well as 2019's trade war. Yet the balance sheet remains a fortress.
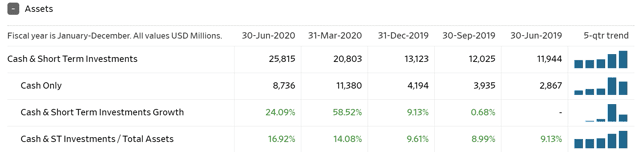
(Source: WSJ)
The company has almost $26 billion in cash and cash equivalents on its balance sheet, representing 17% of its total assets.
Cash has been growing rapidly over the past year, up almost $14 billion since June 2019.
Intel Debt Profile
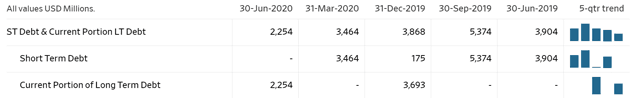

(Source: WSJ)
Short-term debt is $2.3 billion, down from $3.9 billion a year ago.
Long-term debt is up about $10 billion from last year. Though virtually all that was due to INTC, like most companies, issuing a lot of bonds to build up cash reserves during the pandemic.
Bond investors aren’t worried about Intel's $38.6 billion in total debt. And all three rating agencies rate Intel as A+ with a stable outlook, representing about 0.6% long-term bankruptcy risk.
That estimate is confirmed by its very high F- and Z-scores, and the fact that it has a 1.9% average interest cost.
US Government Borrowing Costs

(Source: Treasurydirect.gov)
Intel is currently borrowing at the same interest rate as the U.S. Treasury because the bond market considers it at a very low risk of default.
How low? About 2.4% over the next 30 years.
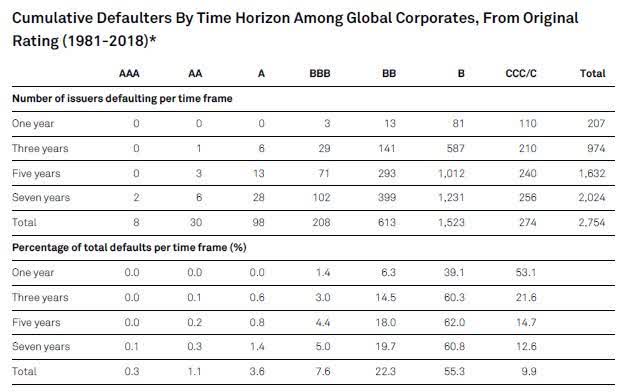 (Source: S&P)
The reason for that is Intel's prodigious free-cash-flow generation.
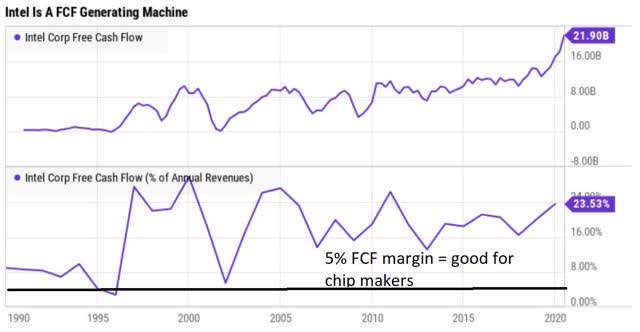 (Source: Ycharts)
Five percent FCF margins are considered good for chipmakers, and INTC's is 23.5%. For context, Apple's (NASDAQ:AAPL) is 23%.
To quote company CFO George Davis on the Q2 conference call (my emphasis):
In Q2, we generated $11.2 billion in operating cash flow, and invested $3.4 billion in CapEx with $7.7 billion of free cash flow, up 92% year-over-year.
We returned $1.4 billion to shareholders via dividends. As a reminder, we paused our share repurchase program in Q1 as we felt it was prudent to do so in the current economic environment.
We expect to complete the balance of our $20 billion share repurchase program and return to our historical capital return practices when market dynamics stabilize.
Over the past five years, Intel has bought back 3.2% CAGR worth of its stock. This represents a relatively strong organic growth catalyst that’s expected to continue into the future.
The company generated almost $22 billion in FCF in the past year – compared with an annual dividend cost of $5.6 billion.
According to FactSet Research, Intel is expected to generate:
- $17.5 billion in FCF in 2020 ($11.8 billion post dividends)
- $17.6 billion in 2021 ($11.8 billion post dividends)
- $21.8 billion in 2022 ($15.2 billion post earnings)
The lower FCF than the past year is due to higher capex costs analysts expect as the company invests in equipment needed to pursue its 5G and digital cloud-focused business opportunities.
The bottom line is that Intel's dividend remains relatively generous for a tech stock. And it’s extremely dependable, with about a 2.5% chance of being cut.
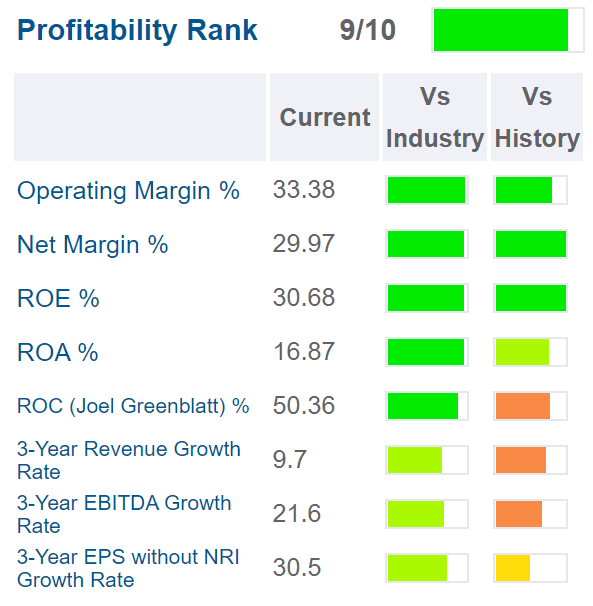
3. Intel Remains a SWAN-Quality Company With Strong Competitive Advantages
Intel scores a 3/3 on my business model scale, indicating a wide moat. And here's why.
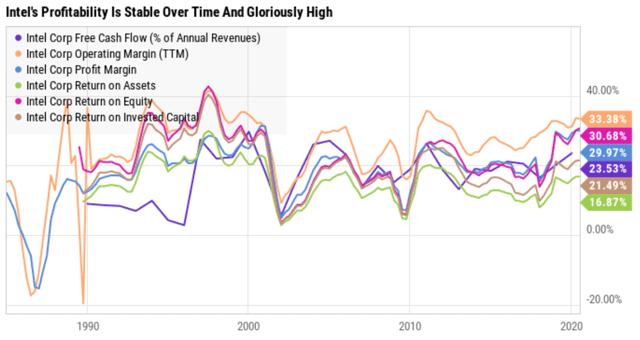
(Source: Ycharts)
Intel's profitability, when adjusted for the cyclical nature of its industry, is stable over time and extremely high.
(Source: Gurufocus)
Intel Profitability Profile
|
Metric |
Industry Percentile |
|
Operating margin |
96.40 |
|
Net margin |
95.90 |
|
Return on equity |
95.22 |
|
Return on assets |
95.47 |
|
Return on capital |
88.47 |
|
Average |
94.29 |
(Source: Gurufocus)
Just 46 out of 805 chipmakers in the world are more profitable than Intel. And its returns on capital are particularly impressive.
Famed hedge fund manager Joel Greenblatt considered return on capital – pre-tax profits/operating capital – to the be the gold standard proxy for company quality and what we call “moatiness.”
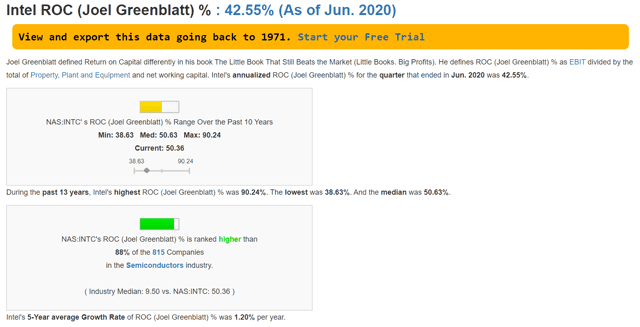
(Source: Gurufocus)
Intel's return on capital took a hit in Q2, as did most companies. Yet it remains over four times that of most other chipmakers. The 13-year median ROC is 51% – indicating that, historically, for each $1 it takes to run the business, Intel generates $0.51 in annual pre-tax profits.
For a capital-intensive industry such as this, that's truly exceptional profitability. It shows that management has been doing a fine job with capital allocation over time.
That's why I rate its management quality/dividend-friendly corporate culture a 2/3, or about average.
Morningstar agrees:
We view Intel's stewardship of shareholder capital as Standard. In January 2019, Intel completed its long-awaited CEO search by removing the interim tag from Bob Swan and promoting him to the permanent position.
Swan’s pre-Intel experience features a stint as an operating partner at private equity firm General Atlantic, director on Applied Materials’ board, and CFO at eBay. We are somewhat skeptical of Swan’s finance-oriented background (similar to former Intel CEO Paul Otellini) and non-Intel background.
That said, we concede the latter could be refreshing for a chipmaker at a crossroads, with growth in core PC and server segments waning and new growth vectors such as artificial intelligence and automotive still nascent, with competition in abundance. Juxtaposed with peers such as Nvidia CEO Jensen Huang and AMD CEO Lisa Su, both engineers, Swan seems somewhat out of place. We will heavily scrutinize Swan’s moves through the lens of assessing whether investments are superfluous or pragmatic, as well as cost-cutting endeavors and potential business impact.
Swan had already been acting as CEO since June 2018. Before that, he was CFO. (Emphasis added.)
In April, Intel appointed George S. Davis as CFO… Davis had been serving as Qualcomm’s CFO since 2013 and was also CFO of Applied Materials for six years previously. We believe Davis has an impressive resume and note Qualcomm has done a solid job in recent years with restructuring efforts revolving around improving QCT profitability. Given the financial backgrounds of both Swan and Davis, we would expect efforts to rein in Intel’s massive spending for both R&D and capital expenditures, which could bode well for investors as Intel streamlines its efforts into core areas such as the data center. We consider the firm to have a deep management bench.
Management has made the right moves to allow Intel to maintain its dominant position in computer processors in recent years, but the success of the firm's recent forays into new markets is still up for debate.
5/5 dividend safety + 3/3 wide-moat business model + 2/3 management quality/dividend friendly corporate culture = 10/11 SWAN quality.
Now, we understand why investor's might be skeptical of management, given the year-long issues surrounding its tech road map execution. And, yes, Intel has made plenty of mistakes in terms of mergers & acquisitions over the years.
But Morningstar, for one, considers even the failed deals to have been financially sound decisions.
Not even great management bats 1.000. Businesses are incredibly complex, especially globally giant ones like Intel.
However, the ultimate test of quality management is seen by a firm's profitability over time. And Intel's is consistently in the top 6% of its peers.
What's more, Morningstar expects that profitability will likely improve above its already fantastic levels in the coming years.
There are risks with any business, of course, and I go over those in detail in part 7.
One of those risks is management attempting to increase profitability at the cost of research and development, and capital expenditures (capex), which are needed to grow the business. As the CFO said:
The combination of our liquidity actions and the higher tax rate alone impact full-year EPS by more than $0.15. We expect 2020 capex of approximately $15 billion and free cash flow of approximately $17.5 billion.
However, that $15 billion indicates that management isn’t just blowing smoke when discussing the pursuit of long-term growth markets.

(Source: Ycharts)
Intel has been steadily increasing its R&D spending over the years, and the same is true of capex/revenue. In the past year, it's spent $13.2 billion on R&D, or 17% of revenue. And it's spent 23% of revenue on capex (about $18 billion).
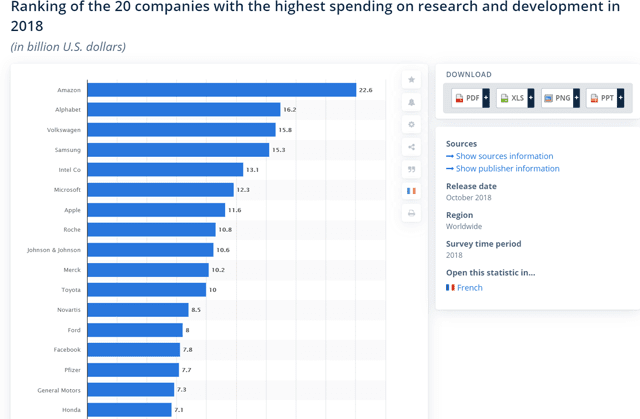
(Source: Statista)
In 2018, the most recent year with the available data, Intel spent $13.1 billion on R&D – the fifth most of any company on earth, and $800 million more than Microsoft (MSFT).
Whether or not R&D and capex are spent efficiently can be determined by long-term profitability. Which, as we've already seen, is among the highest in the industry and relatively stable adjusting for industry cycles.
Which brings us to the long-term growth outlook for Intel, a major concern for investors following the recent chip delay.
4. Growth Outlook Has Dimmed... But Only by About 1% CAGR
The good news for Intel is that this is not a dying business. It’s just one that continues to adapt to changing markets and strong growth runways. To quote CEO Swan again:
In Q2, both our cloud and comms service provider businesses grew more than 40% year-over-year as critical cloud-delivered applications continued to scale and 5G build-outs accelerated. Leading cloud service providers, including Alibaba, Baidu, Facebook, and Tencent, announced they are adopting our third-gen Intel Xeon Scalable processors into their infrastructure and services...
Also this quarter, Azure introduced several new Xeon Scalable instances, including general purpose and memory-optimized Azure Virtual Machines. We were also excited to be a part of an industry first with Rakuten’s full-scale commercial launch of its mobile carrier service...
That means not just playing defense, but positioning our business to grow share in the largest market opportunity in our history. We’ve built scale businesses indexed to key technology inflections such as cloud, AI, 5G, and the intelligent and autonomous edge.
We see a world where everything increasingly looks like a computer, including our homes, our cars, our cities, our hospitals, our factories and now even our schools.
Management is confident that there’s no fundamental issue with its tech roadmap. It regards its long-term growth initiatives as relatively unhampered.
As for Morningstar, it does consider Intel's wide moat affirmed for now but at risk longer-term. With that said:
Despite competitive and manufacturing headwinds, we remain positive on Intel’s scale in cloud computing and opportunities in automotive, 5G, and artificial intelligence, and we think long-term investors should find current levels attractive.

(Source: Investor presentation)
Consider Intel's Mobileye business, which provides hardware for driverless cars. It’s seen rapid growth of 45% CAGR over the last five years. And it continues to win numerous contracts with leading global carmakers and to roll out new products.
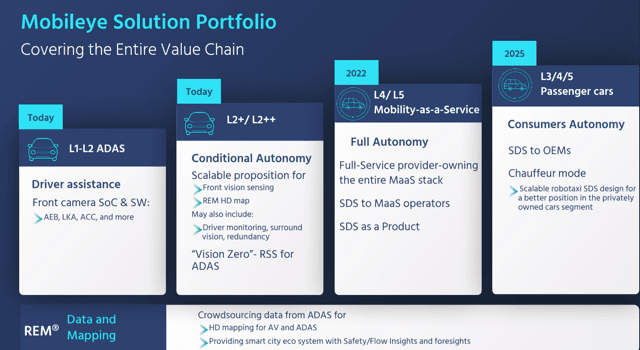
(Source: Investor presentation)
By 2025, it expects to be providing the hardware to enable fully autonomous cars.

Analyst firm IDTech estimates the driverless car market in 2040 will be $2.5 trillion, and the autonomous car hardware market – which is what Intel is focusing on – will be $173 billion.

(Source: Investor presentation)
In terms of overall 5G-related growth opportunities, Intel estimates that its addressable market will be $65 billion by 2023. That’s for things like driverless cars, data center chips, and the internet of things.
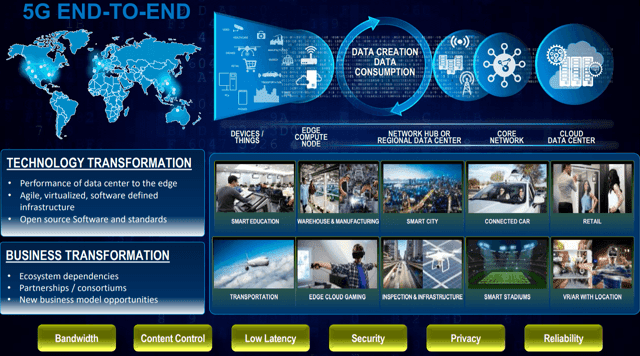
(Source: Investor presentation)
5G is going to be a game changer in the tech world – courtesy of up to 100x faster data transfers, 10x lower latency (how fast machines talk to each other), and improved security.
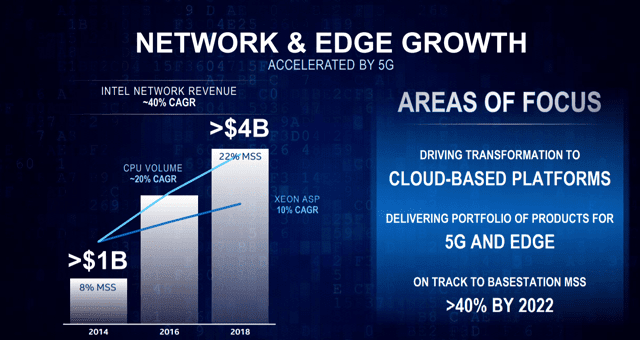
(Source: Investor presentation)
Intel's 5G-related businesses have been growing revenue at an accelerating rate. And management expects that to be over 40% CAGR through 2022.
Today, 52% of Intel's business is data-driven. And growth rates are on track to reach management's medium-term 5G-focused goals.
But let’s move on to the 38 analysts who cover Intel. After all, seven of them did downgrade the stock.
Even so, Intel's earnings consensus for 2020 and 2021 didn’t move from 0% growth. Meanwhile, 2022's growth consensus rose from 5% to 7% due to the new timing on its chip rollouts.
Intel Medium-Term Growth Matrix
|
Metric |
2020 Growth Consensus |
2021 Growth Consensus |
2022 Growth Consensus |
|
Dividend (YOY) |
5% |
2% |
16% |
|
EPS |
0% |
0% |
7% |
|
Owner earnings (Buffett smoothed-out FCF) |
-29% |
11% |
NA |
|
Operating cash flow |
3% |
-2% |
1% |
|
Free cash flow |
8% |
0% |
25% |
|
EBITDA |
10% |
-5% |
10% |
|
EBIT (pre-tax profit) |
12% |
-3% |
2% |
(Source: FAST Graphs, FactSet Research)
There’s no denying that Intel is set for slower growth in the next two years. However, starting in 2022, analysts believe growth will pick up substantially.
That includes a 16% consensus dividend hike in 2022… supported by 25% expected FCF growth that year, which would extend Intel's payout growth streak to nine years.
But here’s the real takeaway: how the long-term growth profile changed after analysts had time to digest everything.
Intel Long-Term Growth Profile:
- FactSet growth consensus through 2022 (includes weak recession years): 2.2% CAGR
- FactSet long-term median growth consensus: 5.9% CAGR (five analysts)
- Ycharts long-term growth consensus: 7.2% CAGR
- Reuters' five-year growth consensus: 8.6% CAGR (32 analysts).
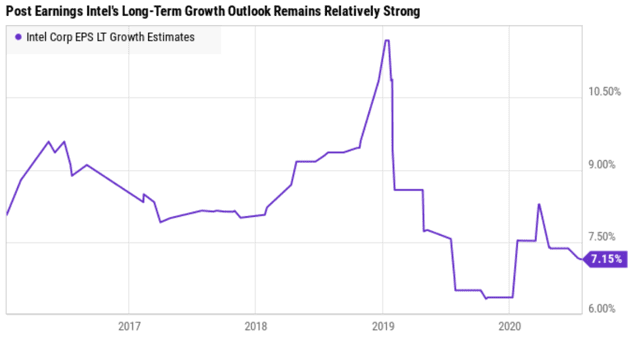
(Source: Ycharts)
Naturally, long-term growth estimates will change over time as companies report results and new challenges crop up and are overcome (or not).
But Intel's growth outlook fell about 1% across all three analyst growth consensus sources. And even the most conservative estimate, FactSet's 5.9% CAGR, is still relatively attractive growth.
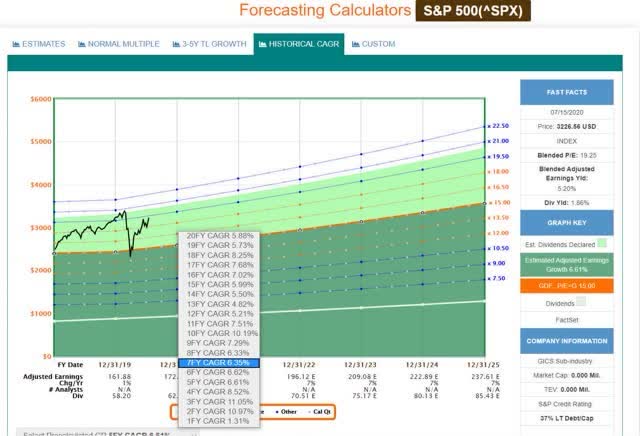 (Source: FAST Graphs, FactSet Research)
The S&P 500's historical EPS growth rate is 5%-8%. And 6.4% CAGR is the probability weighted consensus for the future (adjusting for future recessions).
That's near the mid-range of historical corporate earnings growth of 6.5%. Whereas Intel's growth prospects are actually 3%-13%, the historical margin of error-adjusted consensus growth range.
Let’s start with the 5.9%-8.6% CAGR consensus that analysts currently expect… then consider how often analysts are wrong about Intel's actual growth.
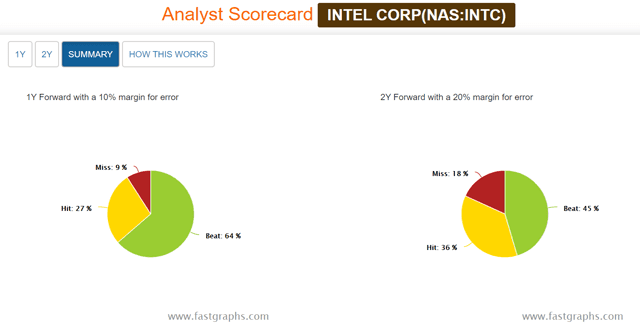

Intel generally does a great job of beating expectations, as it has in nine of the last 11 years. In fact, it’s missed two-year forecasts since 2013, making for a six-year streak of beating expectations.
The historical margin of error for analyst estimates is 40% to the downside, 50% to the upside. It's a cyclical business after all.
Apply those margins of error to the 5.9%-8.6% consensus growth range, and you get 3%-13% expected long-term CAGR.

(Source: FAST Graphs, FactSet Research)
That's well within the company's historical 5%-21% growth range over the past 20 years.
To understand the kinds of returns that entails, first we need to know its historical fair value P/E range.
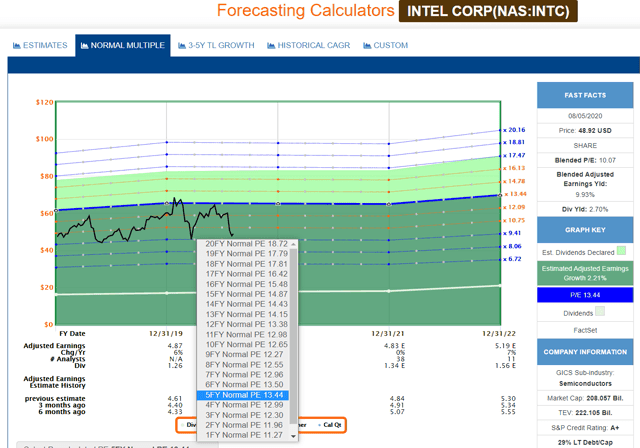
(Source: FAST Graphs, FactSet Research)
Outside of bear markets and bubbles, Intel has generally been valued at 12x-14x earnings. That's below the 15 Graham/Dodd/Carnevale rule of thumb, it’s true. But that's what tens of millions of investors over 20 years have determined it worth – complete with quality, risk profile, and cyclical business model.
Apply the 3%-13% CAGR to the 12-14 historical market-determined fair value range… and you get 8%-17% CAGR total return potential over the next five years.

(Source: FAST Graphs, FactSet Research)
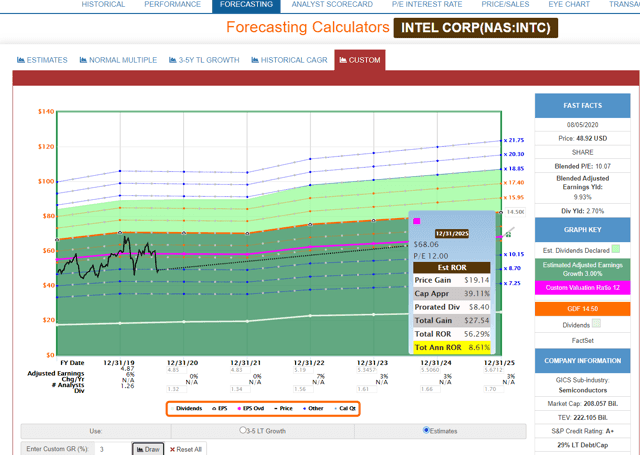
If Intel grows as expected through 2022 and returns to historical fair value, then about 15% CAGR total returns could be expected.
INTC 2022 Consensus Return Potential

(Source: FAST Graphs, FactSet Research)
INTC 2025 FactSet Consensus Return Potential

(Source: FAST Graphs, FactSet Research)
If INTC grows as fast as FactSet expects, it could deliver about 12% CAGR total returns over the next five years.
INTC 2025 Ycharts Consensus Return Potential
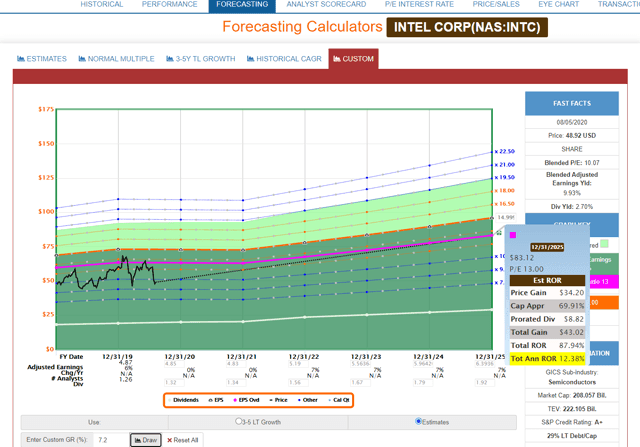
(Source: FAST Graphs, FactSet Research)
If INTC grows as fast as Ycharts expects, then about 8% higher returns would be expected over the next five years, nearly doubling an investors' money.
INTC 2025 Reuters' Consensus Return Potential
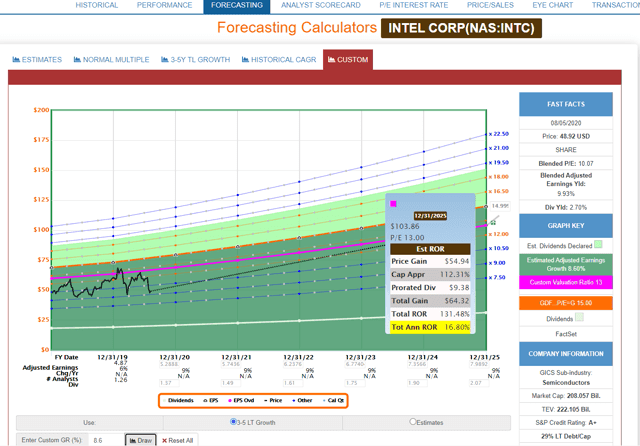
(Source: FAST Graphs, FactSet Research)
If it grows as fact as Reuters expects, investors could see 131% total returns, or nearly 17% CAGR.
Now compare that with the S&P 500, which is trading at some of the most extreme levels in history.
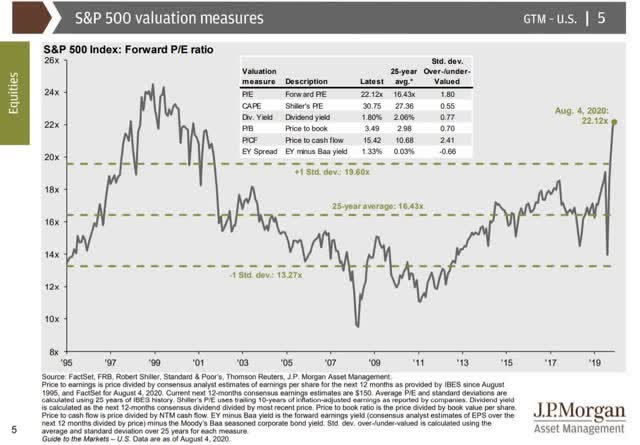
 JPMorgan reports that forward one-year return expectations are near zero, and five-year market return expectations are slightly negative.
S&P 500 Valuation Profile
|
Year |
EPS Consensus |
YOY Growth |
Forward P/E |
Blended P/E |
Overvaluation (Forward P/E) |
Overvaluation (Blended P/E) |
|
2020 |
$124.79 |
-23% |
26.7 |
23.6 |
63% |
39% |
|
2021 |
$163.31 |
30% |
20.4 |
23.5 |
25% |
38% |
|
2022 |
$186.18 |
13% |
17.9 |
19.1 |
9% |
13% |
|
12-month forward EPS |
12-month forward P/E |
Historical overvaluation |
PEG |
20-year average PEG |
S&P 500 dividend yield |
25-year average dividend yield |
|
$144.65 |
23.0 |
40% |
2.71 |
2.35 |
1.79% |
2.06% |
(Sources: Dividend Kings S&P 500 Valuation & Total Return Potential Tool, FAST Graphs, FactSet Research, Brian Gilmartin, Reuters'/Refinitiv/IBES/Lipper Financial, Ed Yardeni, JPMorgan, Multipl.com)
What kind of returns can investors expect from the second-highest valuation in history?
S&P 500 Total Return Profile
|
Year |
Upside Potential by End of That Year |
Consensus CAGR Return Potential by End of That Year |
Probability-Weighted Return (OTC:CAGR) |
|
2020 |
-34.6% |
-64.9% |
-48.7% |
|
2021 |
-14.2% |
-10.4% |
-7.8% |
|
2022 |
0.3% |
0.1% |
0.1% |
|
2025 |
27.2% |
4.5% |
3.5% |
(Sources: Dividend Kings S&P 500 Valuation & Total Return Potential Tool)
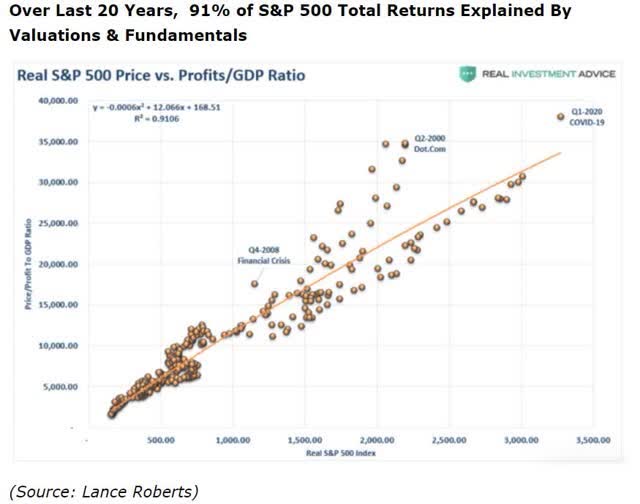
In order to convert consensus return potentials to expected returns, we need to account for the fact that fundamentals drive just a fraction of short to medium-term returns.
After 10+ years, fundamentals are 10x as powerful as sentiment, momentum, and luck.
|
Time Frame (Years) |
Total Returns Explained by Fundamentals/Valuations |
|
1 day |
0.05% |
|
1 month |
0.9% |
|
1 year |
8% |
|
2 years |
18% |
|
3 years |
27% |
|
4 years |
36% |
|
5 years |
45% |
|
6 years |
54% |
|
7 years |
63% |
|
8 years |
72% |
|
9 years |
81% |
|
10+ years |
90%-91% |
(Sources: Dividend Kings S&P 500 Valuation & Total Return Potential Tool, JPMorgan, Bank of America, Princeton, Lance Roberts)
But in the short term, such as under 12 months? Fundamentals and valuations have very little to do with stock returns.
Since five-year returns are historically 45% explained by fundamentals, we need to apply a wide margin of error to consensus return estimates. (Chuck Carnevale recommends 50%.)
2025 S&P 500 Probability-Weighted Expected Return Calculator
|
5-year consensus annualized total return potential |
4.54% |
|
Conservative margin of error adjusted annualized total return potential |
2.27% |
|
Bullish margin of error adjusted annualized total return potential |
6.81% |
|
Conservative probability-weighted expected annualized total return |
1.36% |
|
Bullish probability-weighted expected annualized total return |
5.45% |
|
Mid-range probability-weighted expected annualized total return potential |
3.41% |
(Source: Dividend Kings Investment Decision Tool)
The broader market is likely to deliver between 1% and 6% CAGR returns over the next five years. That makes 3.4% a reasonable mid-range estimate.
How about Intel? Using the most conservative long-term consensus growth forecasts, we get this:
2025 INTC Probability-Weighted Expected Return Calculator
|
5-year consensus annualized total return potential |
11.7% |
|
Conservative margin of error adjusted annualized total return potential |
5.85% |
|
Bullish margin of error adjusted annualized total return potential |
17.55% |
|
Conservative probability-weighted expected annualized total return |
3.51% |
|
Bullish probability-weighted expected annualized total return |
14.04% |
|
Mid-range probability-weighted expected annualized total return potential |
8.78% |
|
Ratio vs. S&P 500 |
2.58 |
(Source: Dividend Kings Investment Decision Tool)
In short, we expect Intel to deliver 2%-15% CAGR total returns by the end of 2025. Though 9% is our reasonable expectation.
That's 158% better than the S&P 500's probability-weighted expected return – which makes Intel a relatively attractive tech blue-chip to consider buying today.
That's courtesy of Intel's reasonably attractive valuation.
5. Valuation Is Attractive
Intel is currently trading at a blended P/E of 10.1. That’s a level it normally bottoms out at during recessions and industry downturns.
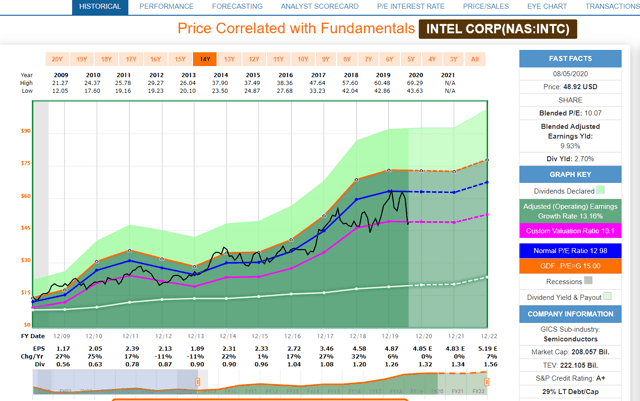
(Source: FAST Graphs, FactSet Research)
That alone strongly suggests this is a potentially good time to open a position. But here’s Morningstar’s analysis as well:
We are raising our fair value estimate to $70 per share from $65 per share, as we incorporate a stronger near-term outlook. Our fair value estimate implies an adjusted P/E ratio of 14 times.
Over the next five years, we assume mid-single-digit revenue growth on average. In the near term, we see Intel’s PC-derived revenue declining in the low single digits. However, the proliferation of cloud computing and burgeoning artificial intelligence trend will provide tailwinds for the data center group, or DCG, which we see growing at an 9% CAGR through 2024. In 2020, we expect DCG to be up in the mid-single-digits, as the aforementioned tailwinds are partially offset by greater competition from AMD…
Intel’s historical lead in process technology benefits from sizable R&D expenses (19% of revenue on average in recent years), which is critical to the firm’s ability to sustain its advantage. Going forward, we believe the firm's drive to ramp 10-nm and regain its competitive edge with a fast-follow 7-nm ramp in 2021 will pressure gross margins by a few hundred basis points. Coupled with the renewed competition with AMD, we see gross margins in the high-50s in the coming years.
Nonetheless, we think the firm can drive operating leverage with more-focused research and development spending toward data center and automotive end markets, while shifting resources away from non-core areas such as 5G modems and the NAND business, leading to operating margins in the low 30s.
Morningstar's fair value estimate is based on estimated EPS that's 3% above the analyst consensus of $4.85, which is a bit high but not unreasonable. Intel frequently beats expectations, after all.
Of course, Chuck Carnevale recommends looking at numerous metrics, not just earnings. So here we go…
Intel Valuation Matrix
|
Metric |
Historical Fair Value (11 years) |
2020 |
2021 |
2022 |
|
5-year average yield |
2.68% |
$49 |
$50 |
$58 |
|
13-year median yield |
2.88% |
$46 |
$47 |
$54 |
|
Earnings |
12.6 |
$61 |
$61 |
$65 |
|
Owner earnings |
12.0 |
$44 |
$49 |
NA |
|
Operating cash flow |
7.7 |
$59 |
$58 |
$59 |
|
Free cash flow |
15.0 |
$61 |
$61 |
$76 |
|
EBITDA |
7.1 |
$58 |
$55 |
$60 |
|
EBIT |
10.7 |
$60 |
$58 |
$59 |
|
Average |
$55 |
$55 |
$62 |
(Source: FAST Graphs, FactSet Research)
Incidentally, $55 is the average historical fair value based on the multiples investors have determined to be Intel's fair value over times of similar growth and fundamentals. So that’s our reasonable estimate of what it's worth this year.
Next year's flat growth means no increase in fair value. Though, in 2022, fair value is expected to jump to $62.
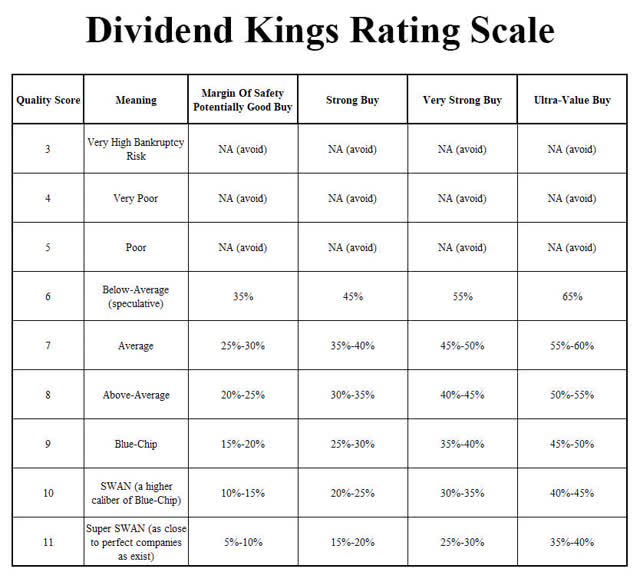
Intel DK Ratings
|
Rating |
Margin of Safety for 10/11 SWAN Quality Companies |
2020 Price |
2021 Price |
|
Potentially reasonable buy |
0% |
$55 |
$55 |
|
Potentially good buy |
10% |
$52 |
$52 |
|
Potentially strong buy |
20% |
$47 |
$47 |
|
Potentially very strong buy |
30% |
$41 |
$41 |
|
Potentially ultra-value buy |
40% |
$36 |
$36 |
|
Currently |
$48.52 |
12% |
12% |
6. Intel Is a Very Prudent Tech Name
We discuss the following often enough, but since it’s worth repeating…
Intel Investment Decision Score
|
Goal |
INTC |
Why |
Score |
|
Valuation |
Potential good buy |
12% undervalued |
4/4 |
|
Preservation of capital |
Excellent |
A+ stable credit rating = 0.6% 30-year bankruptcy risk |
7/7 |
|
Return of capital |
Good |
15.7% of capital returned over the next 5-year via dividends vs. 10.6% S&P 500 |
7/10 |
|
Return on capital |
Exceptional |
8.8% PWR vs. 3.4% S&P 500 |
10/10 |
|
Relative investment score |
90% |
||
|
Letter Grade |
A- very good |
||
|
S&P |
73% = C (market-average) |
(Source: Dividend Kings Investment Decision Tool)
Note that if you use the higher Ycharts of Reuters' consensus growth estimates, Intel scores an 8/10 on dividend-return potential. In which case, it becomes a 93% A/excellent potential investment.
7. Risks to Consider
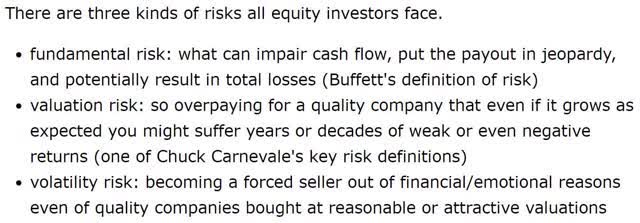 The most obvious fundamental risk to Intel's business and those mouthwatering profitability metrics are:
- Competition
- Tech disruption.
As previously mentioned, Intel's major rivals include AMD and Nvidia (NVDA). Both are also competing in 5G, driverless cars, and datacenters.
TSMC – a major foundry provider that makes chips for companies like Intel – is currently working on a 3nm chip design. This indicates that Intel's 10nm and 7nm designs may be behind the curve.
If its rivals can execute better on more advanced chip designs, than Intel's market-share maintenance and expansion goals could be in jeopardy.
As we’ve also already shown, Intel investors must also be comfortable with the naturally cyclical nature of the industry. That has led to volatile earnings such as:
- 2001-2002 recession: -72%
- 2006 industry downturn: -40%
- 2008: -22%
- 2012-2013 industry downturn: -22%
- 2020-2021 recession/industry downturn: 0% growth.
Of course, being the world's largest chipmaker with a fortress balance sheet and $26 billion in cash helps ameliorate such risks significantly. Intel has a "deep bench" management team and a mountain of resources with which to adapt and overcome its current challenges.
That’s hardly 100% protection, but it does help significantly.
So too does buying Intel with a sufficient margin of safety of 10%. The current valuation risk is moderate since it’s currently trading near the bottom of its historical recession range.
Over the last 20 years, the market hasn’t seemed to ever price Intel at less than 9x earnings. Though it could potentially send it down to a record low P/E of 8x or even 7x in a fit of irrational panic.
(Source: Ycharts)
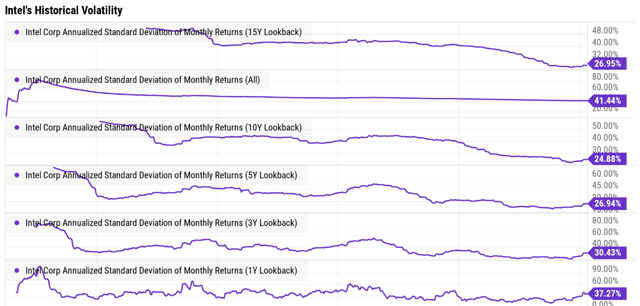
Intel is actually not a particularly volatile stock relative to the 26% annual volatility most companies experience. Over the last 15 years, its average annual volatility has been 27%.
But during short periods of intense market panic – such as during the tech bubble bursting – that can certainly change.

(Source: Ycharts)
Intel fell like a stone during the March crash, right to the low end of historical P/E of 9x, and then bottomed. That indicates there’s likely limited short-term downside to buying Intel right now.
Of course, if it wants to fall further, we'd be happy to buy Intel at the lowest valuations in its history, assuming the fundamental thesis remained intact.
Just as long as investors understand this next point… that it was so overvalued in the tech bubble (315% overvalued at its peak) that it fell 81% during the crash over a period of 25 months.
It then took 17.5 years for speculators who paid an absurd valuation to get back to break even, including dividends.
We don’t foresee that happening again, but that kind of volatility is in its history nonetheless.
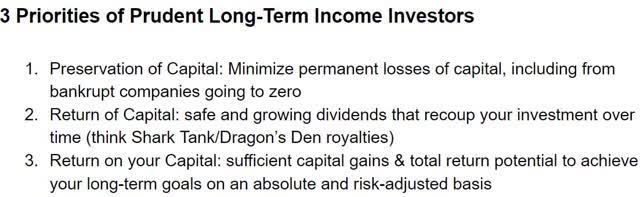
8. How to Own Intel in a SWAN Retirement Portfolio
Risk management is the first step to long-term financial success.
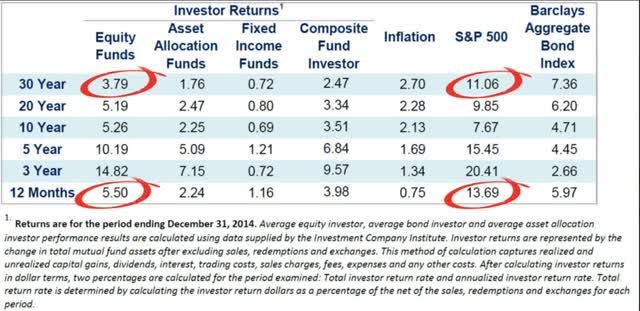
Investors have historically done a horrible job investing in stocks and bonds, as evidenced by 30 years of research.
 (Source: Dalbar)
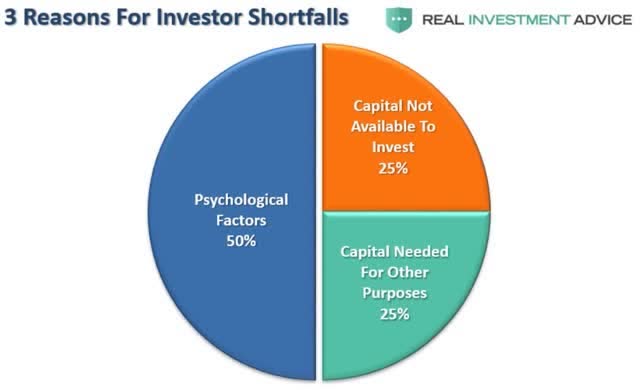
The reason for such horrible returns is improper risk management, specifically poor asset allocation for each investors risk profile.
 (Source: Lance Roberts, Dalbar)
In short, if you have the wrong mix of cash/stocks/bonds, you can become a forced seller for emotional or financial reasons.
 This is why we’re so fanatical about risk management and safe portfolio construction. And why we keep preaching Professor Jeremy Siegel's 75/25 recommended stock/bond asset allocation.
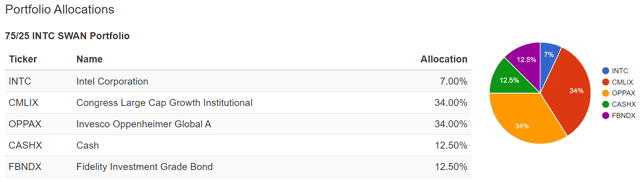
Let's consider a hypothetical INTC-focused SWAN portfolio that's 7% Intel. Another 68% is then invested into two blue-chip mutual funds that have been around long enough to let us back-test to 1986. That includes four recessions and several bear markets.
(Source: Portfolio Visualizer)
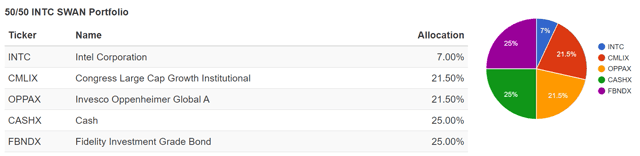
Note that CMLIX and OPPAX are representative of large-cap and global indexes. And FBNDX is a proxy for bonds in general. CASHX, meanwhile, is a proxy for T-bills.
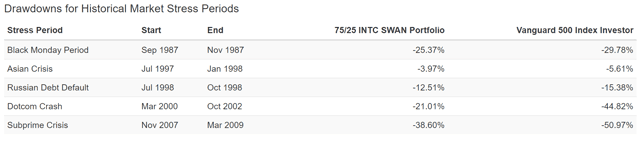
Every bear market is different, it’s true. But it's reasonable to assume that if your portfolio did okay in the Great Recession and COVID-19 crash – two of the most extreme economic conditions in U.S. history – you won't lose sleep in any future recessions either.
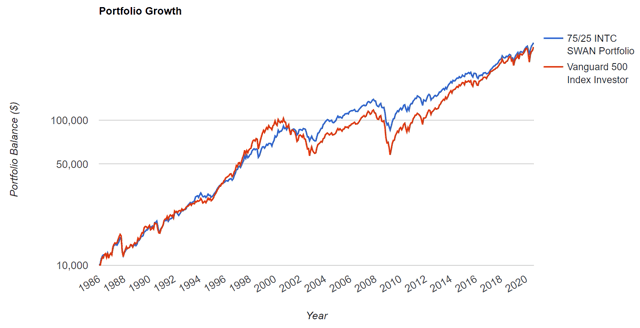
75/25 INTC SWAN Portfolio Since 1986 (Annual Rebalancing)
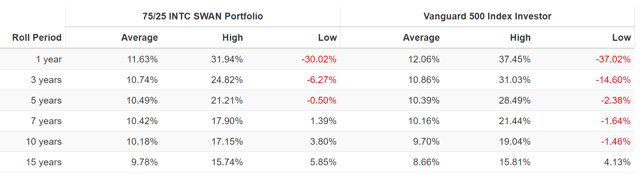
(Source: Portfolio Visualizer)
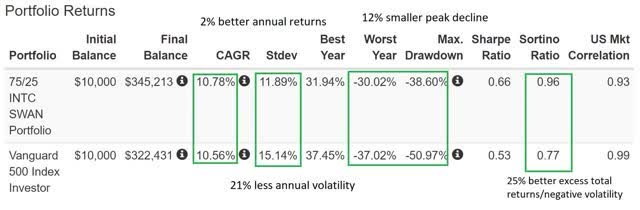
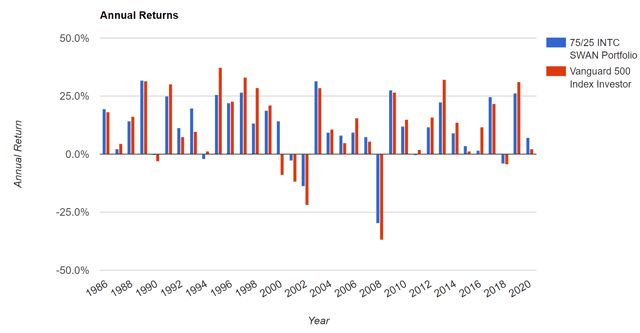
This portfolio managed to match the S&P 500 over 34 years… while suffering far less volatility.
Mind you, no sensible investor would actually expect this to happen if they started from today's record-low bond rates. But the point is the power of bonds/cash to serve as stable sources of non-correlated assets you can tap into during periods of market panic.
That prevents you from having to sell stocks in a bear market to fund expenses. And that’s the primary reason for owning cash/bonds.
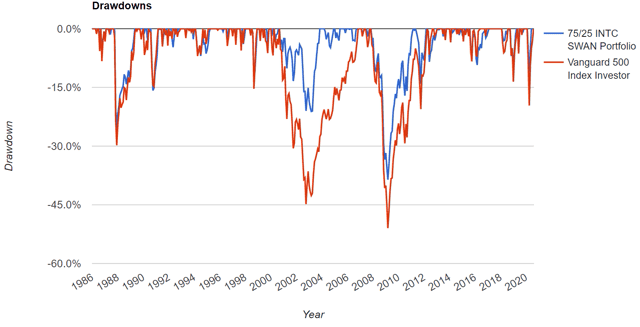

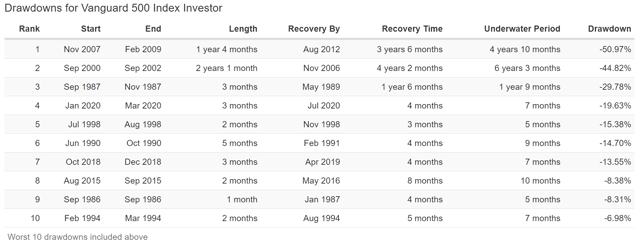
(Source: Portfolio Visualizer)
This portfolio recovered from the tech crash three years and two months earlier than the S&P 500. That's easily the difference between having to sell stocks at a loss to fund retirement expenses… and being able to live on cash and then bonds until a bear market ends.
Next up, we’ll see what a far more conservative version of this SWAN portfolio would have done over the decades.
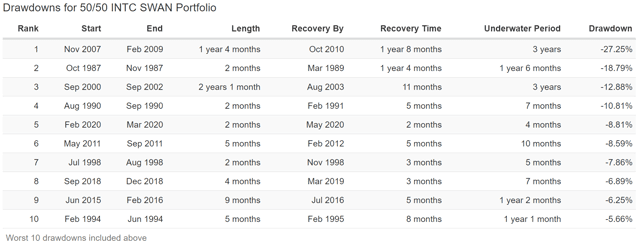
Ultimate Intel SWAN Portfolio
(Source: Portfolio Visualizer)
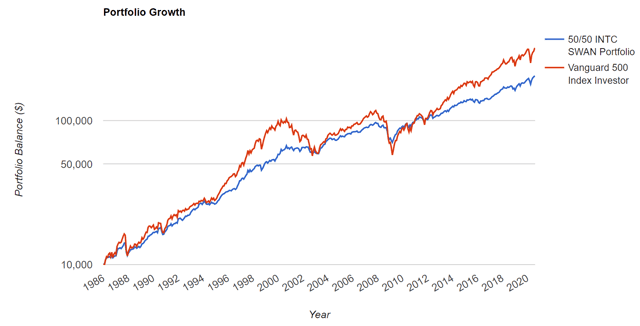
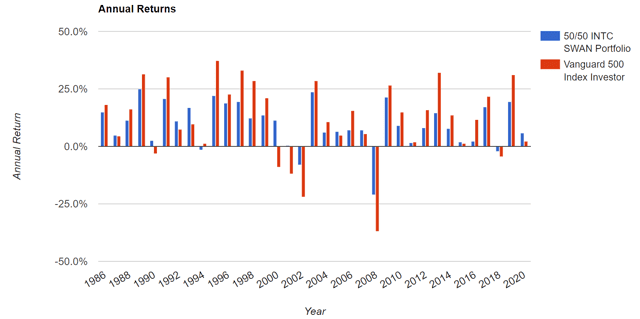
And then let's see how this portfolio would have fared over four recessions and four bear markets.
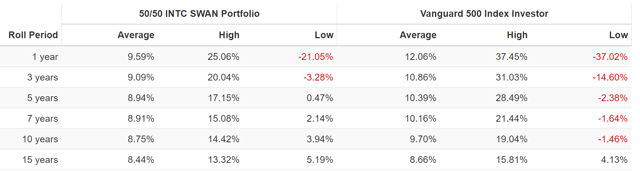 (Source: Portfolio Visualizer)
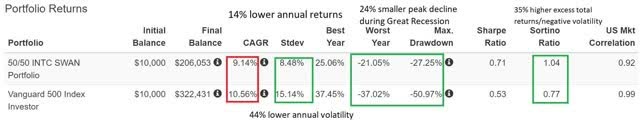
As expected, a 50/50 stock/bond portfolio underperformed the S&P 500 over the last 34 years, but not by much.
The strongest bond rally in history allowed for 86% of market's returns but with 44% less volatility. Going forward, this won't be possible, admittedly. But it is possible to manage your risk, specifically that of becoming a forced seller.

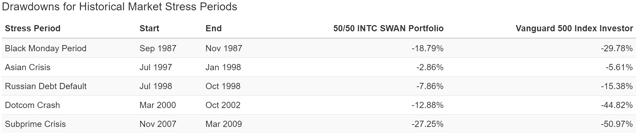

(Source: Portfolio Visualizer)
In 34 years, this portfolio suffered just one bear market vs. four for the S&P 500. So, clearly, bonds serve an important purpose, even in today's low-interest-rate environment.
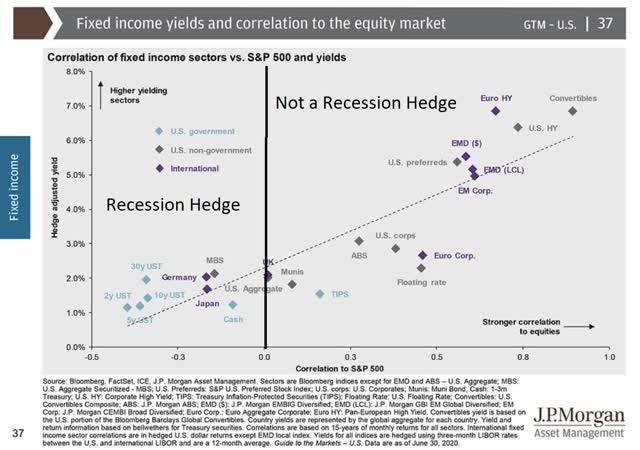 Risk-free bonds are a recession hedge because they have negative correlation to stocks.
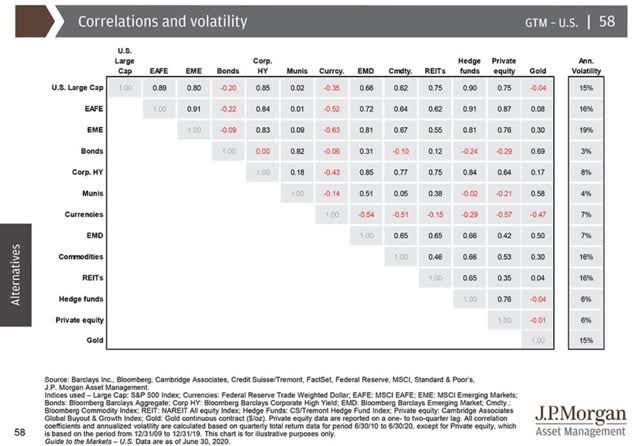 Bonds are the lowest volatility asset class there is, averaging just 3% annual volatility over time.
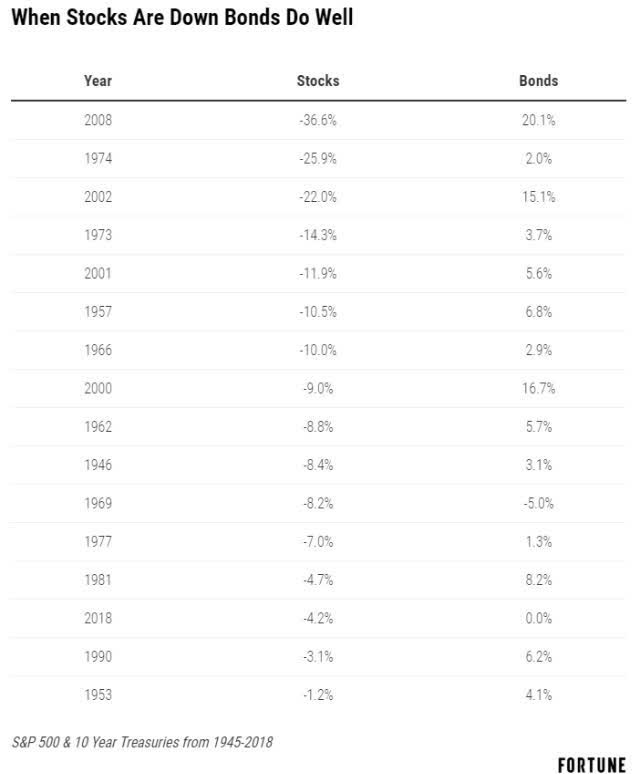 Since 1945, bonds have gone up or remained stable in 92% of the years that stocks have fallen. No stock is a true bond alternative since stocks are risk-assets and high-quality bonds (like Treasuries) aren't.
Keep that in mind, and you’re already in a better place.
Bottom Line: Intel Is a Potentially Great Dividend Growth Stock
Intel's disappointing news during earnings might be what investors are focusing on, for understandable reasons.
However, despite the very negative sentiment surrounding this 10/11 quality SWAN stock right now, the long-term thesis remains intact.
Yes, the long-term growth outlook fell by about 1% CAGR. But the consensus range remains 5.9%-8.6%, and 3%-13% CAGR growth is likely over the coming years.
At the current 12% discount to fair value, Intel is a potentially good buy for anyone seeking dependable dividends that are expected to grow modestly over time.
In today's dangerously overvalued and tech-crazed market, Intel represents a prudent investment.
This is why the Dividend Kings has opened a starter position in the chip giant. It plans to keep buying more in the coming weeks and months if we can get a good buy price.
Author's note: Brad Thomas is a Wall Street writer, which means he's not always right with his predictions or recommendations. Since that also applies to his grammar, please excuse any typos you may find. Also, this article is free: Written and distributed only to assist in research while providing a forum for second-level thinking.
We Can Help You "Put REITs in Retirement"
At iREIT, we're committed to assisting pre-retirees and retires navigate the REIT sector. As part of this commitment, we decided to provide our readers with a 20% discount to our service and we will also be included a copy of my book, The Intelligent REIT Investor. Don't miss out on the opportunity as we are limiting the 20% discount to our first 50 new members.

* Limited to first 50 new members * 2-week free trial * free REIT book *
Disclosure: I/we have no positions in any stocks mentioned, and no plans to initiate any positions within the next 72 hours. I wrote this article myself, and it expresses my own opinions. I am not receiving compensation for it (other than from Seeking Alpha). I have no business relationship with any company whose stock is mentioned in this article.
The Link LonkAugust 10, 2020 at 06:00PM
https://ift.tt/2XKo3rC
8 Things Intel Investors Need To Know After The Stock's 20% Plunge - Seeking Alpha
https://ift.tt/2YXg8Ic
Intel


No comments:
Post a Comment