Identifying The Highest And Lowest Quality Public Companies In America
By way of background, Risk Research develops software for hedge funds and institutional investors, and now makes that analysis available to Seeking Alpha readers. The software runs thousands of credit risk analysis ratios against the financial statements of all public companies, and then ranks them by quality. The software is focused on free cash flow rather than reported earnings, on rolling four-quarter results as opposed to latest quarter versus a year ago, and on balance sheet trends.
The primary financial statement trends and characteristics the software is designed to recognize:
- High return on assets by free cash flow.
- High growth, particularly revenue and free cash flow. As part of this analysis we also consider gross profit growth, operating income growth, and earnings per share.
- Balance sheet strength and trend.
- High yield backed by more than adequate dividend coverage by free cash flow, and strong financial statement trends.
Based on this analysis, we produce two weekly reports: Quality Compounders and Dividend Compounders. Intel qualifies for the first grouping rather than the second only because it yields, at its current price, 2.73%. To qualify for the Dividend Compounders it would need to yield at least 3%.
We also follow approximately 95 companies with the opposite characteristics – declining margins, increasing debt, unable to cover their dividend out of free cash flow – and that have the additional criteria of a minimum market cap of $1 billion. These are companies best avoided by conservative investors, including income investors. We call them the Dirty Dogs, and to protect our portfolio of quality companies against major market declines, we also short them.
Timing
When the market is open, we follow these approximately 175 companies on an hourly basis, scanning for advantageous pricing, or pricing that has historically generated returns of over 20% a year. We’ve developed computer software that tracks the price-to-simple moving average of the highest and lowest quality public companies in America. The deviations from that average over the last nine and a half months, maximum, median and mean, are analyzed. The recurring buy and sell relationships are noted and taken advantage of with the use of thousands of calculations.
The basis of the software is a probability assessment that weighs risk against return, including the risk of waiting for a better price against the return likely at the current price. Each stock's simple moving average is constantly changing and so the buy and sell levels are constantly shifting, although generally just slightly. However, if volatility increases significantly, if, for instance, a stock should collapse, the buy-sell level spread will adjust immediately.
As examples, the following are two trades, one long and one short, that we closed out last week. We bought Amazon (AMZN) on the decline July 21 to July 24.
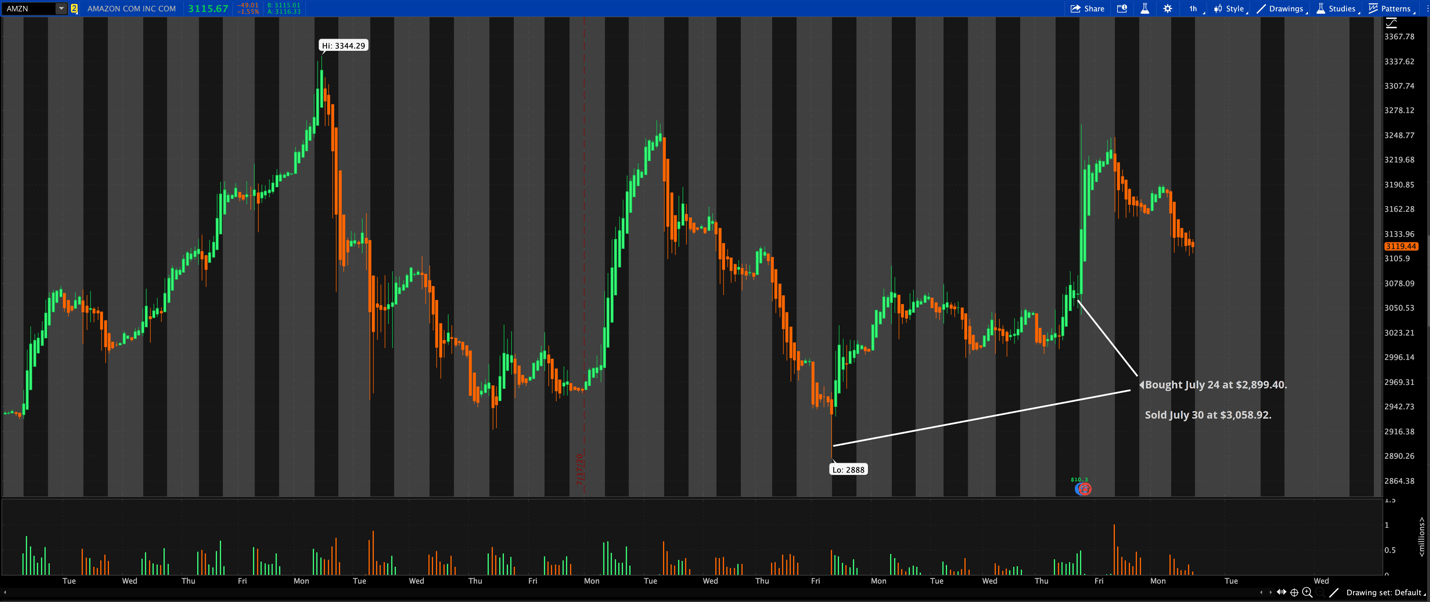 Source: TD Ameritrade (Thinkorswim) Above And For The Stock Charts Below
To hedge our long positions, we also took a short position in Goodyear Tire (GT) as follows:
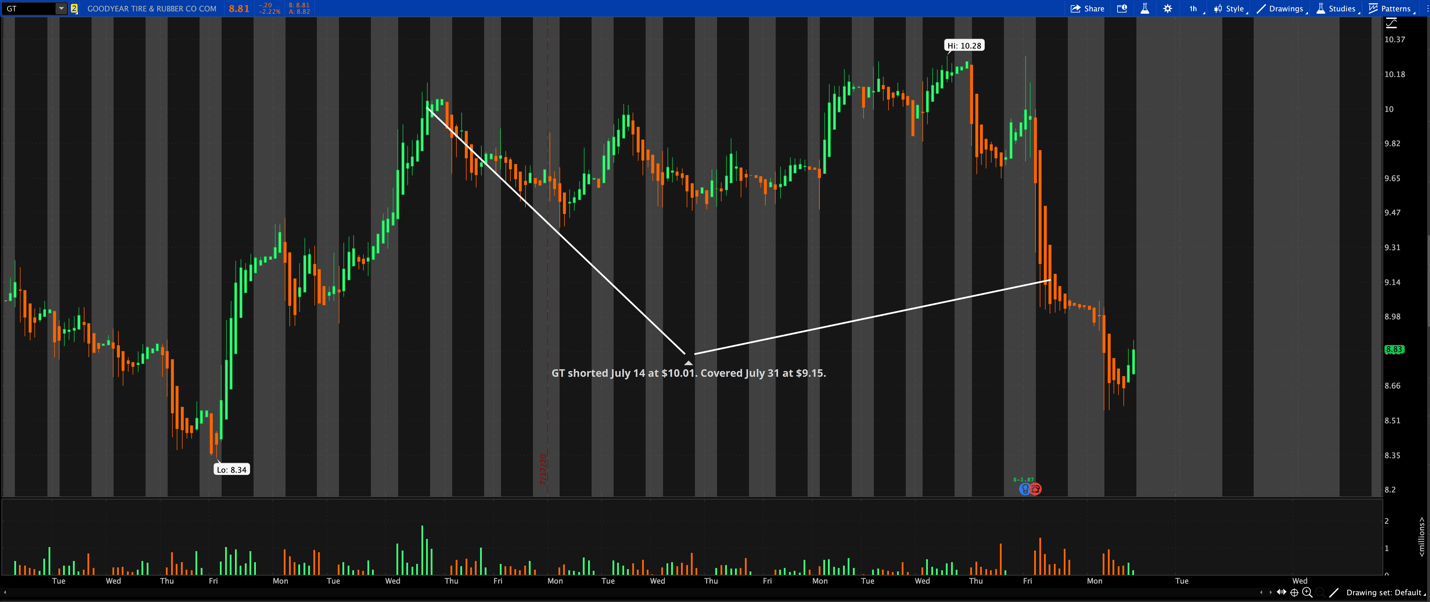 In all, we closed nine trades last week. Eight were winners, one was a loser. The trades returned 4.84% on average, with an average holding period of 11 days. Annualized return 165%.
The best thing that happens to us is when a great company gets into temporary trouble. ... We want to buy them when they're on the operating table.
- Warren Buffett
Intel is not on the operating table, but you'd never know that from the financial press and sell-side analyst reports. As a result, the stock suffered a 16% decline in one day, its worst single-session percentage loss since Oct. 16, 2002. The stock declined another five percent over the following week. Some reasons for the stock’s weak recent performance:
- Intel delayed by six months the launch of a new generation of chips based on 7-nanometer technology.
- Apple (NASDAQ:AAPL), which accounts for 3-5% of Intel revenues, is switching from Intel chips to its own, in-house manufactured chips over the next two years.
- Intel has shaken up its technology team, including replacing two executives involved in the 7-nanometer project.
To put these developments in perspective, here is an excerpt from the company’s latest quarter earnings release:
Intel (NASDAQ:INTC): Q2 Non-GAAP EPS of $1.23 beats by $0.12; GAAP EPS of $1.19 beats by $0.15.
Revenue of $19.7B (+19.4% Y/Y) beats by $1.15B.
Not exactly evidence of the total incompetence of management and pending financial disaster that characterizes many reports.
Financial Statement Condition And Trends
Our research is based on fact not conjecture. We don’t write reports on companies saying, “Company XYZ isn’t much this year, but just wait ‘till next.”
Here’s a summary of some key financial statement ratios, comparing Intel to AMD (NASDAQ:AMD), the company many analysts believe will supplant Intel, or that at least represents a better investment.
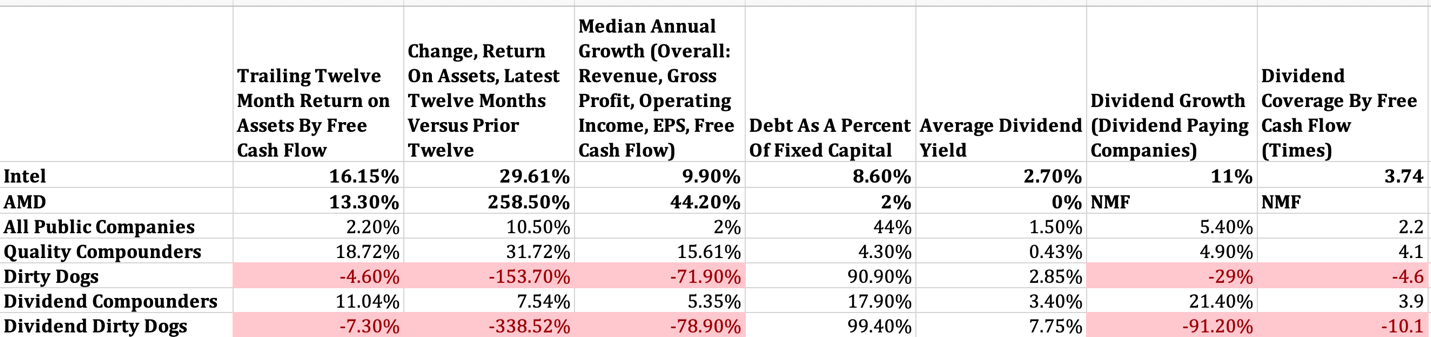 Source: Risk Research Inc.
Comment:
- Intel remains a more profitable company than AMD, although AMD has substantially higher growth.
- With a return on assets over the last 12 months of over 16%, and a ten-year average return on assets of 14.44% (versus AMD’s 0.61%), Intel remains highly profitable.
- If you studied, and understood the implications of that chart, you'd have an advantage over ninety percent of all investors.
In other words, despite the bad publicity and weak stock price, Intel is actually doing fine. Our reports consist of 11 pages of graphs and tables accompanied by succinct conclusions. Here are some of the key graphs showing Intel’s free cash flow, financial strength and intrinsic value trends.
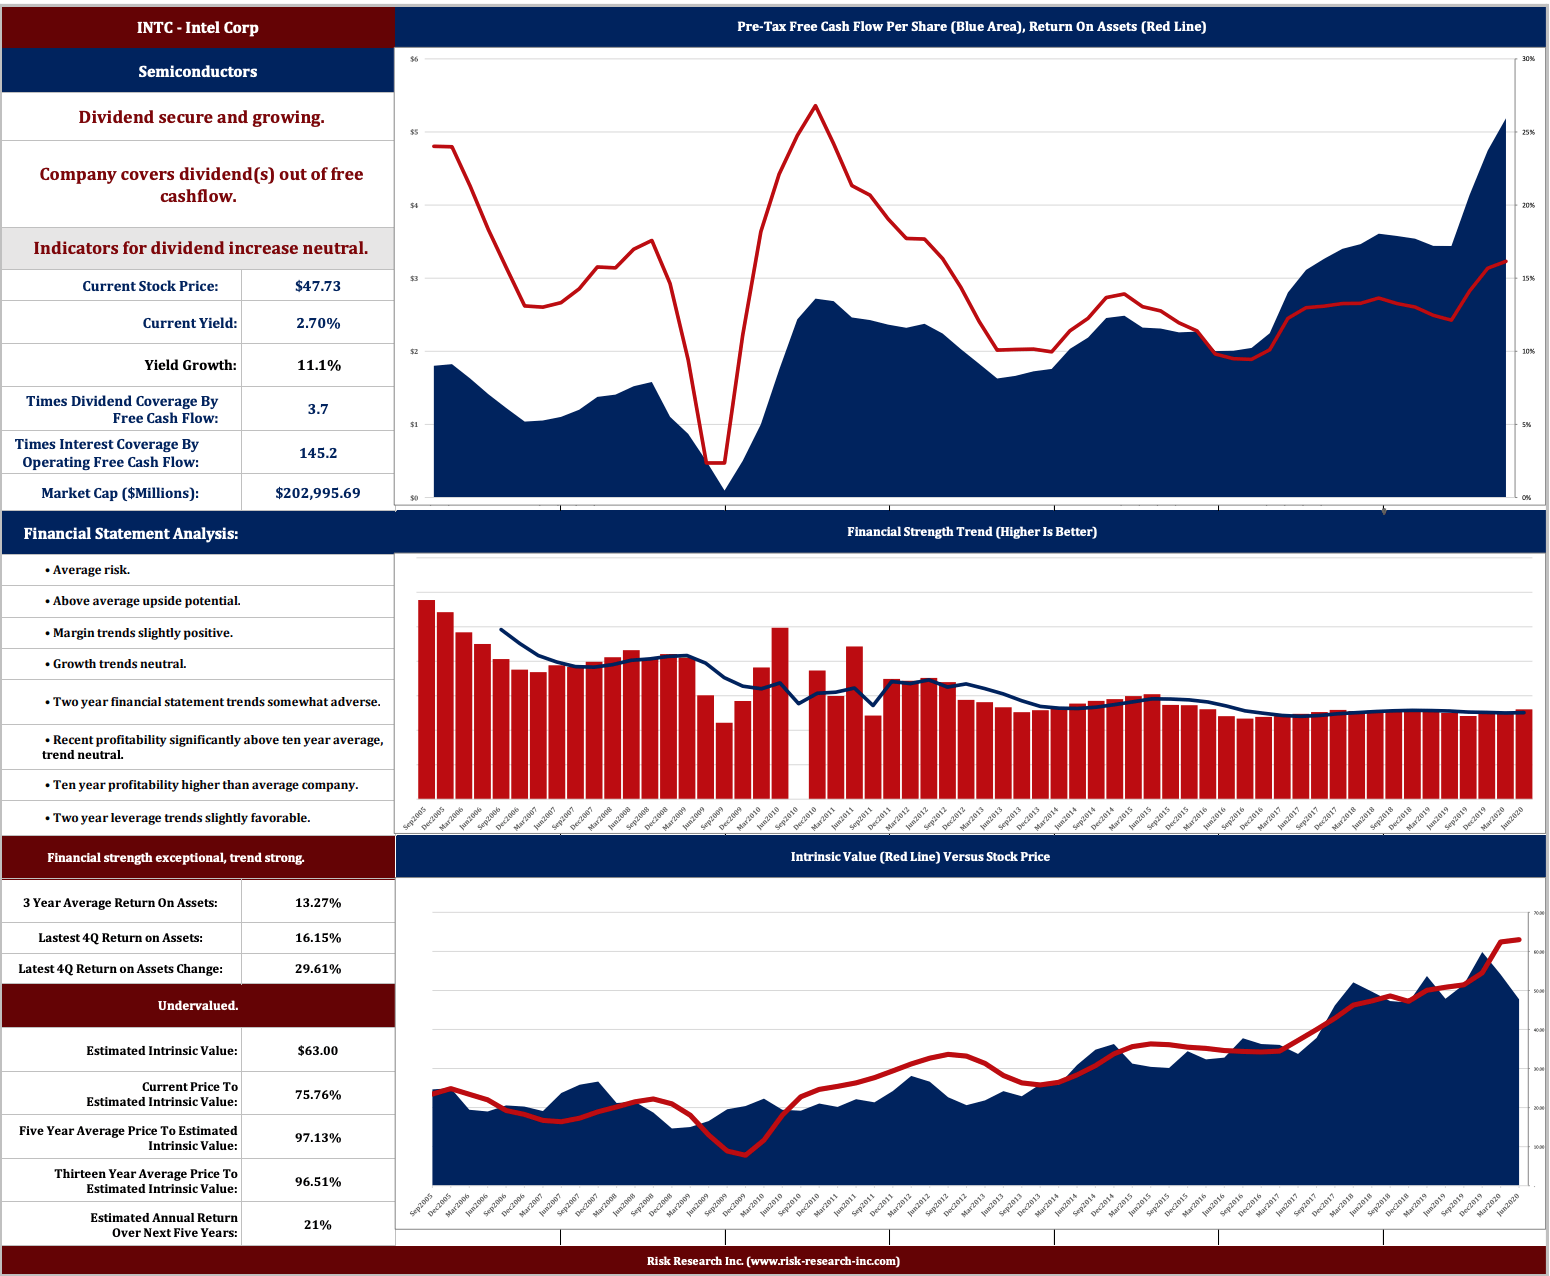 Here are the company’s long-term trends:
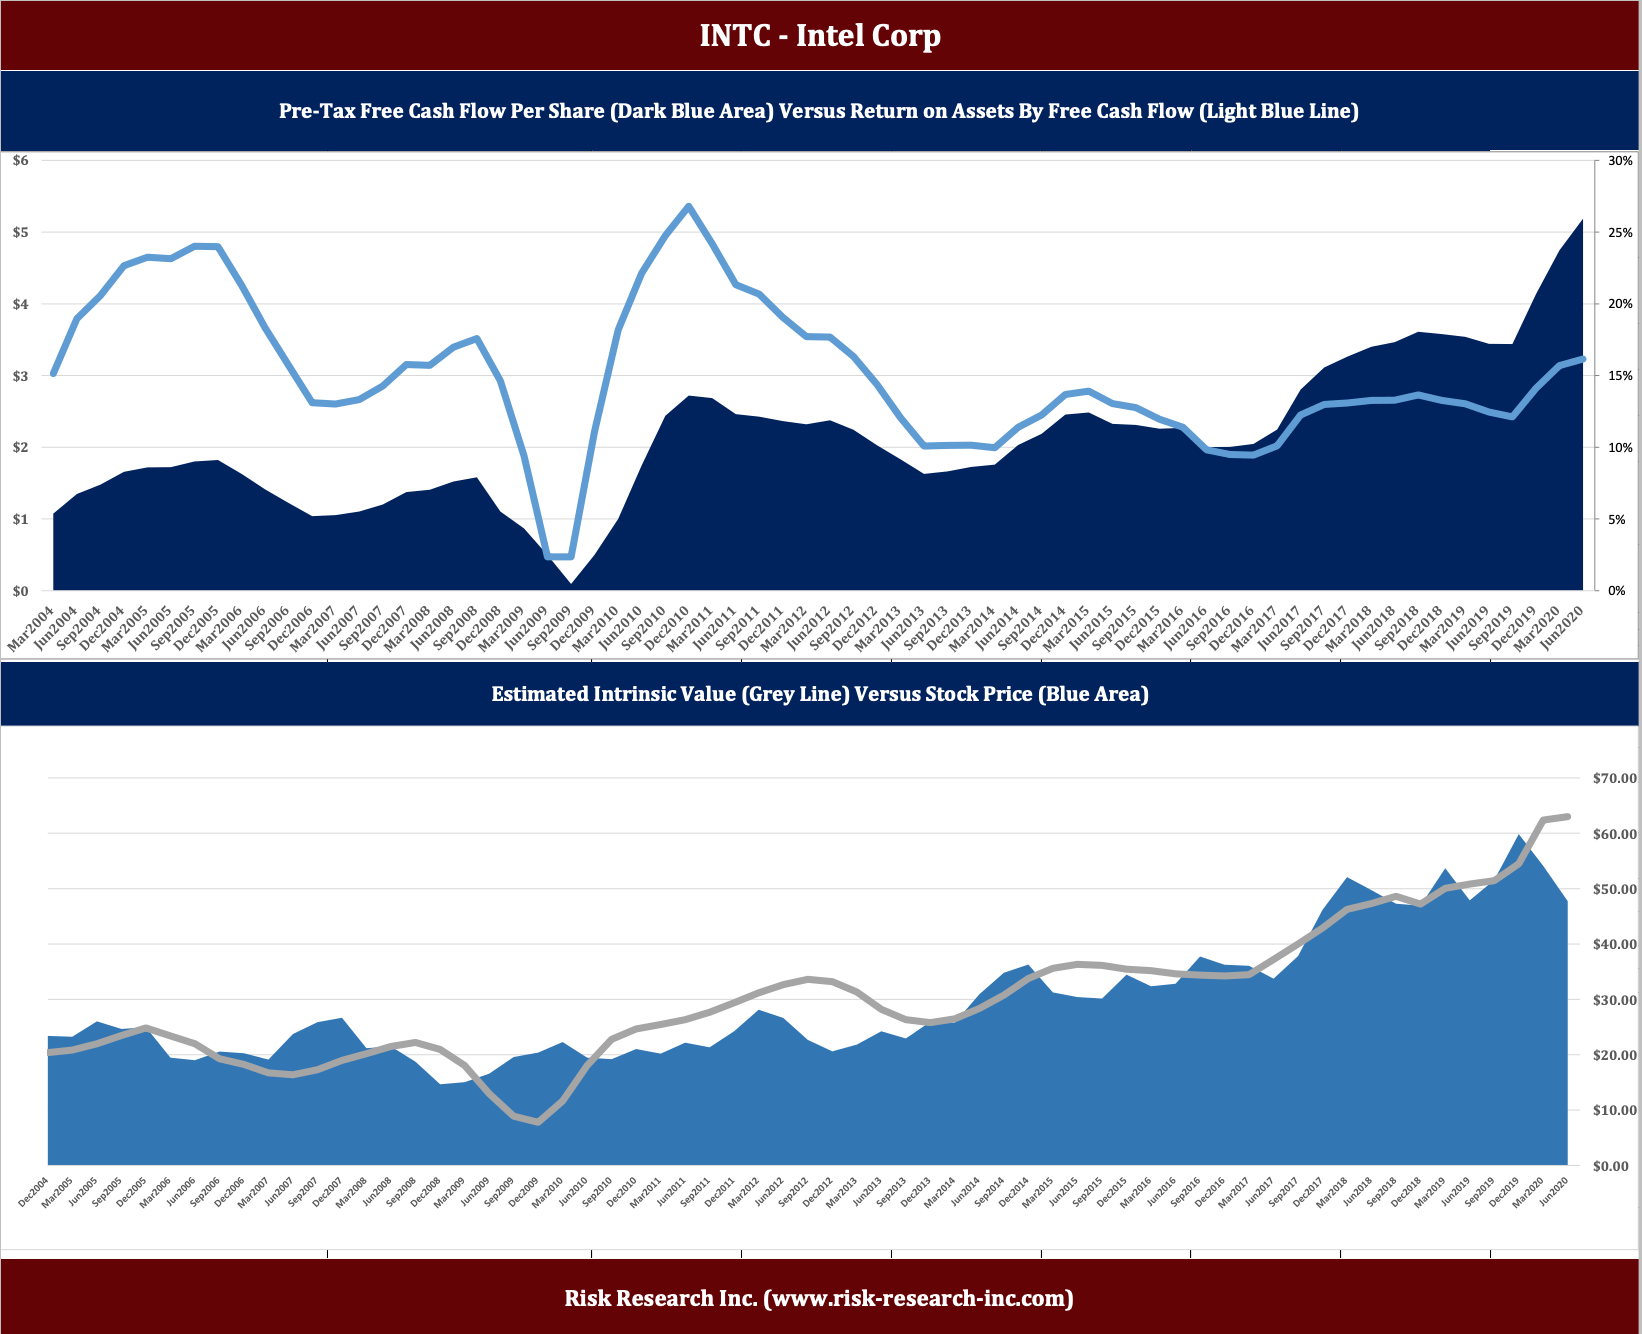
Note, in the lower graph, the relationship between the company’s stock price and our estimate of net asset value. It is currently trading toward the bottom end of that long-term range.
While we question the usefulness of price to intrinsic value – it tends to eliminate from an investor’s portfolio the most dynamic and well-positioned companies – we do see real significance to the slope and consistency of the grey line in the lower graph – growth in intrinsic value. Only the very highest quality companies are capable of a steady, high rate of intrinsic value growth. By this measure, Intel is a quality company.
For comparison purposes, here are the similar graphs for AMD.
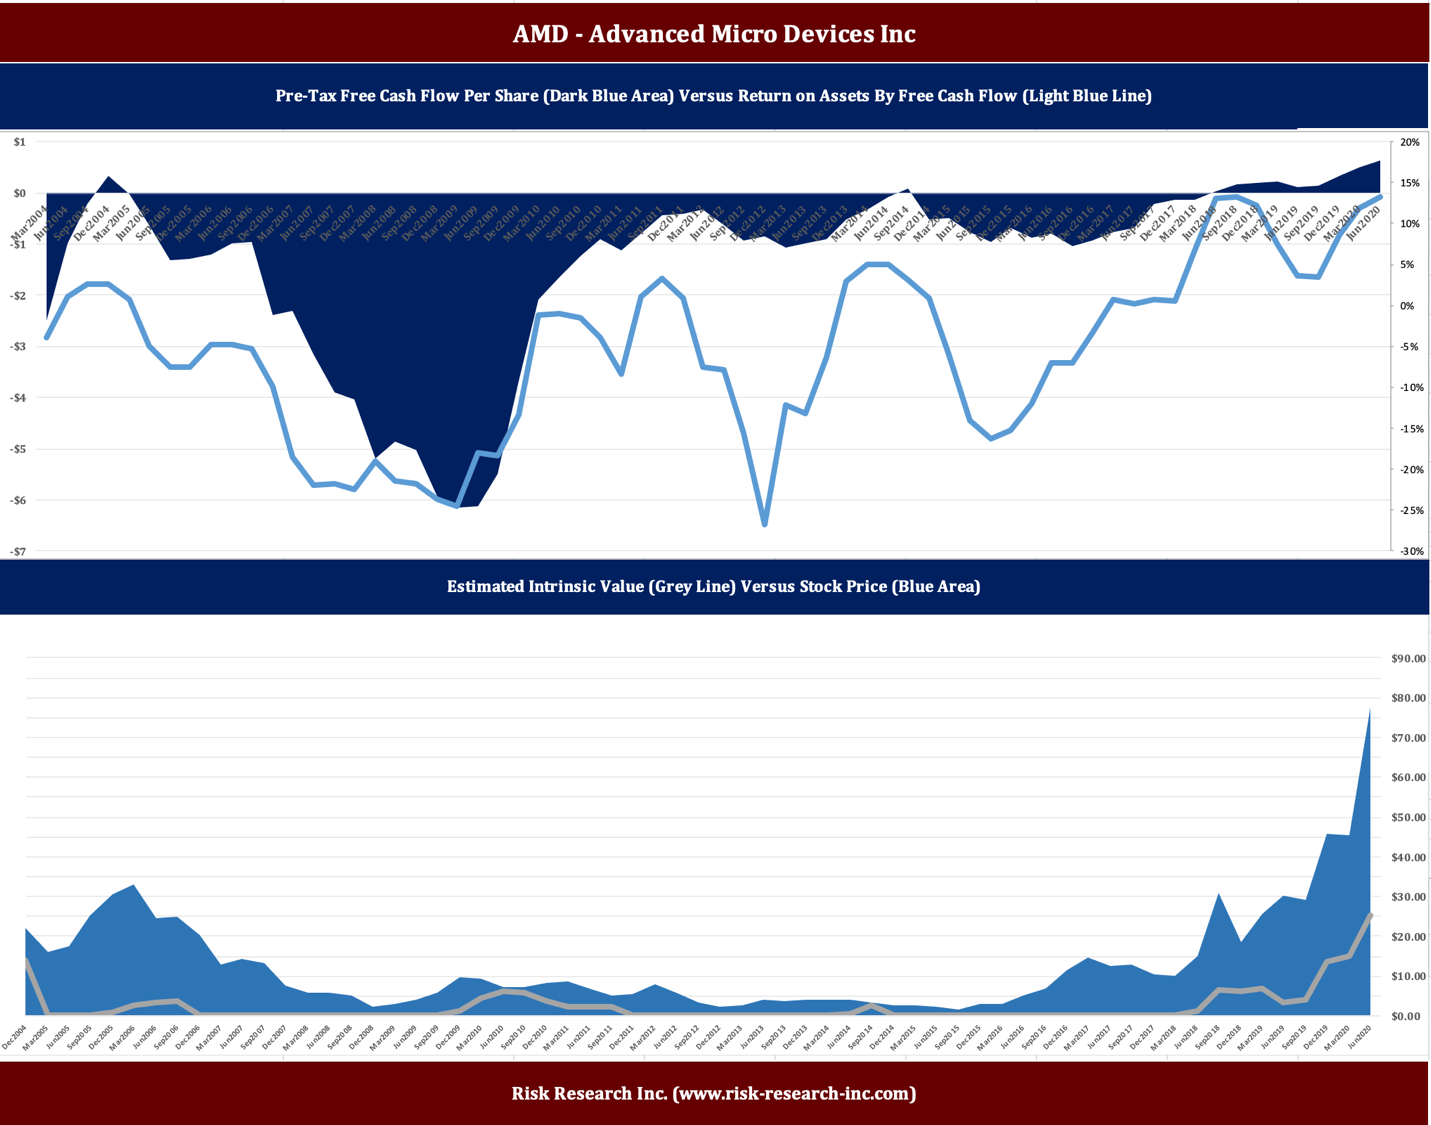 AMD is the company many analysts believe will displace Intel. That is not reflected by financial statement trends.
Investment Strategy
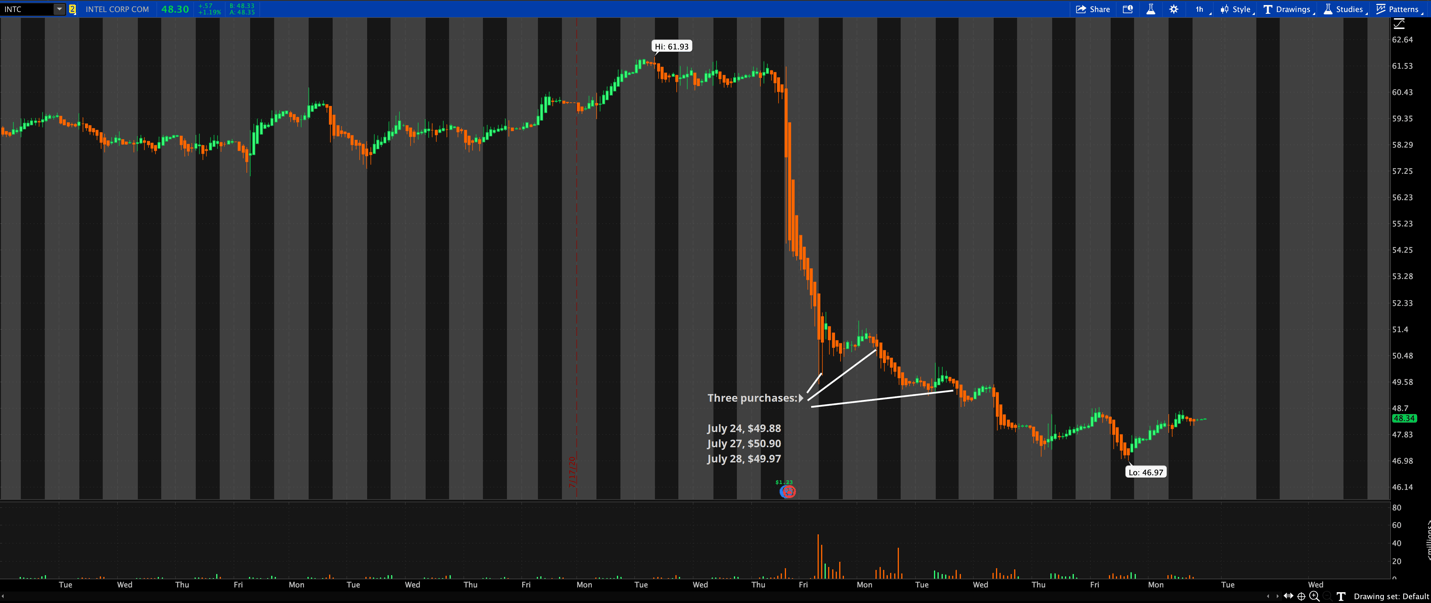
We invest in the highest quality public companies in America on price weakness. Here’s a graph indicating our recent purchases of Intel at an average price of $50.25.
As described above under “Timing,” we have developed computer models that identify buy-sell levels that have historically generated annual returns in excess of 20% a year. The following screenshot shows a portion of the computer print-out for Intel. The basic principle is to buy quality on weakness, and sell poorly-performing companies on strength.
By way of example, say a $100 stock has $10 per share in free cash flow, and that free cash flow has reliably grown at 15% a year. In addition, assume its simple moving average has increased at an average of 15% a year. This is not far-fetched; we’re often surprised how closely a company’s long-term free cash flow growth resembles its simple moving average. In our example, the maximum deviation from that average over the last 9.5 months is 12% on the high and 6% on the low, and the median deviation is 4% on the high and 3% on the low, and the average deviation is 4.5% on the high and 4% on the low.
Under those circumstances, the Algo is likely to indicate buy at $94.50 and sell at $106. Or something like that. There are thousands of calculations and if the Algo notices it is not capturing enough of that high-low deviation it will self-correct. It runs thousands of calculations per company per run.
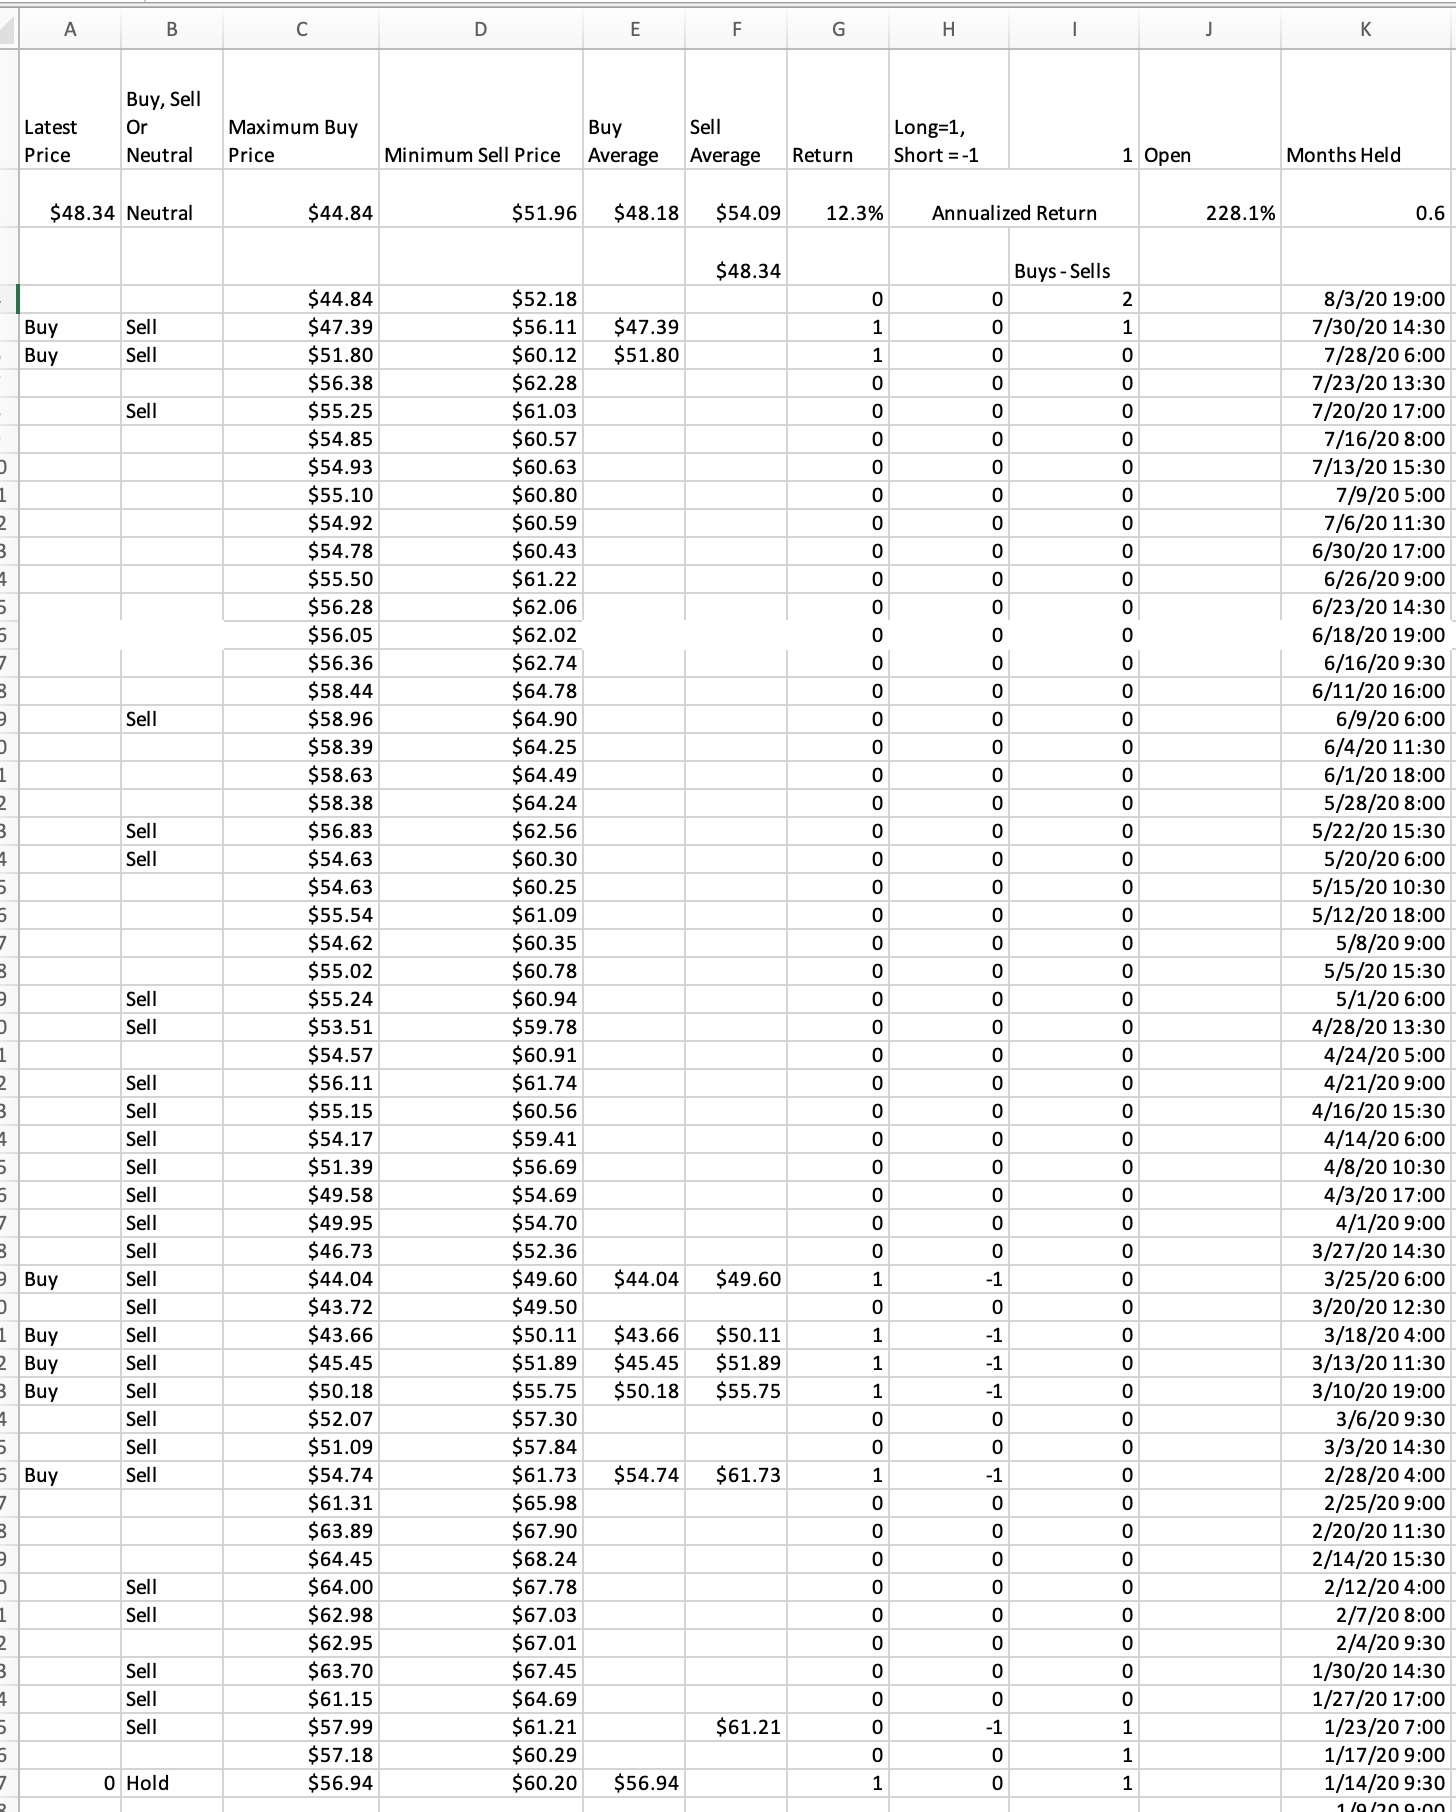 Source: Risk Research Inc.
The numbers above don’t match our purchases exactly, and the printout shows two recent purchases rather than three because the software runs throughout the day and with each run, the numbers differ slightly. The buy-sell spread, for instance, increases as volatility increases, and falls when volatility declines.
Conclusion
Intel's setbacks are widely discussed, and its management subject to much derision and Monday morning quarterbacking by people with little or no managerial experience, who have in fact not ever managed anything. The company itself continues to perform well.
We see opportunity in the bad news. The crucial issue is: has the company lost what makes it special in the marketplace? Does it make a unique contribution to a set of customers? We base our analysis on fact, not conjecture. The facts – the financial statement trends – suggest that yes, Intel continues to be a well-positioned, quality company.
We take two or three percent positions up to a maximum of six to nine percent of portfolio in each company in our portfolio. If we’re overexposed short, we’ll take the larger three percent long position, and vice versa. We exit positions when the Algo indicates that the maximum probability-weighted return has been achieved. As of the computer run shown above, which was completed after the market close on August 3, it indicates a buy below $44.84 and a sell above $51.96.
Historically, five out of six trades have been profitable with an average return of five to ten percent, and average holding period of ten days. On the negative side, this strategy often involves holding losing positions, and even increasing those positions as they move against us. Maintaining a substantial cash position in order to be prepared for any eventuality the market may throw at us is an important part of this strategy. We’re opportunists. An opportunist without cash is an amateur.
It is about probabilities and fact rather than conjecture and intuition.

A subscription to Quality Compounders includes two reports:
- The Quality Compounders Report • The Dirty Dogs
Eleven-page reports are published each week on each company consisting mostly of graphs and succinct conclusions, over 1,000 pages in total.
We invite you to sign up for a two week trial.
Disclosure: I am/we are long INTC. I wrote this article myself, and it expresses my own opinions. I am not receiving compensation for it (other than from Seeking Alpha). I have no business relationship with any company whose stock is mentioned in this article.
Additional disclosure: Seeking Alpha does not provide space in the general position declaration to list more than one long or short. Risk Research Inc. is constantly in and out of the stocks discussed in the article.
We offer this research as insight into what we do in our own portfolio rather than as a recommendation or offer to buy or sell securities. We manage a highly-diversified, long/short portfolio. Surviving risk -- the hundred-year flood or pandemic -- is top of mind. A cash position, generally substantial except in major, major market declines, is an important part of our investment strategy.
If your portfolio is concentrated, this research should not be your sole source of information. It is based on probabilities, not certainties. In the markets, you meet the enemy and he is you. By that I mean biases, the difference between what we would like to be true and what is true, between what we know and what we think we know. It is easy to lose money. Be careful.
The Link LonkAugust 04, 2020 at 10:49PM
https://ift.tt/33uQTjc
Intel: When It Comes To Investing In Quality, There's Opportunity In Bad News - Seeking Alpha
https://ift.tt/2YXg8Ic
Intel


No comments:
Post a Comment